

What the van and tools cost and what a service call brings in are only the start of a first-year plan. Our HVAC business plan template puts them next to everything else the first year depends on: monthly overhead, how many jobs your technicians can actually run, wages, the owner draw and any startup loan. From there it builds a 12-month profit and loss and a separate cash forecast, and shows how many jobs a month it takes to cover the bills.
Download the HVAC business plan template. It’s a plain .xlsx file with no macros and no sign-up. Every figure in it is a placeholder, so replace them with your own quotes and prices and the plan recalculates.
Video walkthrough
This short captioned walkthrough goes from the pricing and capacity inputs to the profit and loss, the cash forecast, the startup costs and the Dashboard figures.
Who this template is for
It’s for anyone opening an HVAC company, or running one with a few technicians, who needs a first-year plan for a lender, a partner or themselves. It suits a tech going out on their own with one van as well as an owner adding a second or third truck.
The workbook answers five questions:
- How much cash does it take to open the doors?
- What does it cost each month to stay open?
- How many jobs a month cover those costs?
- In which month does the business first make a profit, and when does cash stop going down?
- How low does the bank balance get on the way?
A business plan also needs words: your services, your service area, who you’re competing with and how you’ll win work. The workbook covers the numbers. The written part is yours, and the figures on the Dashboard are the ones it should quote.
What’s in the workbook
There are six sheets, in this order:
- Instructions covers setup, the color legend, the limitations, and a note that every formula, layout choice and sample figure was written from scratch for this file.
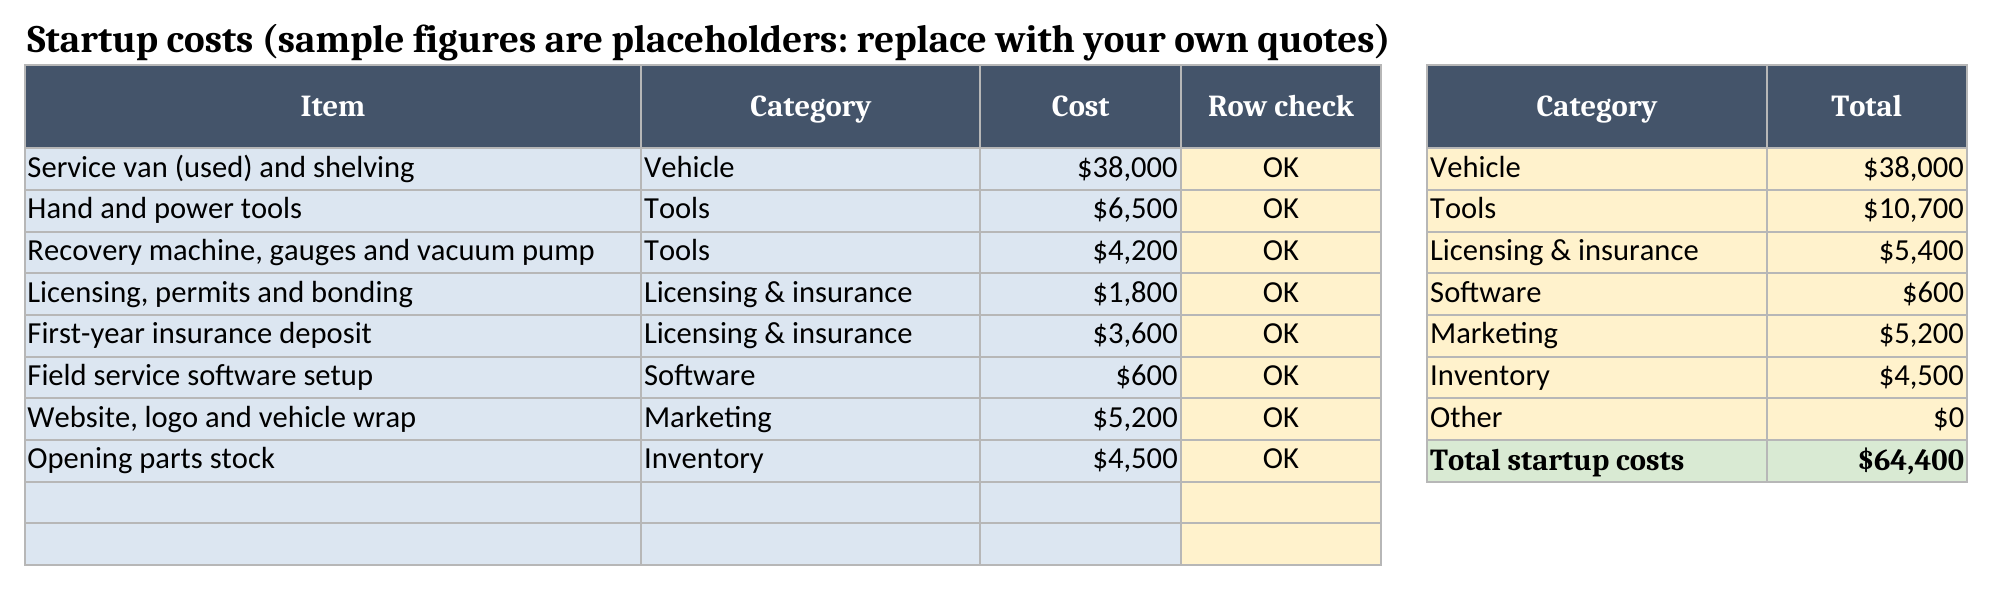
- Startup Costs lists what you buy before the first job, one row per item, with a category from a fixed list and a cost. The total and a by-category table sit to the right.
- Overhead lists your monthly fixed costs: insurance, fuel, rent, software, phone, marketing, bookkeeping.
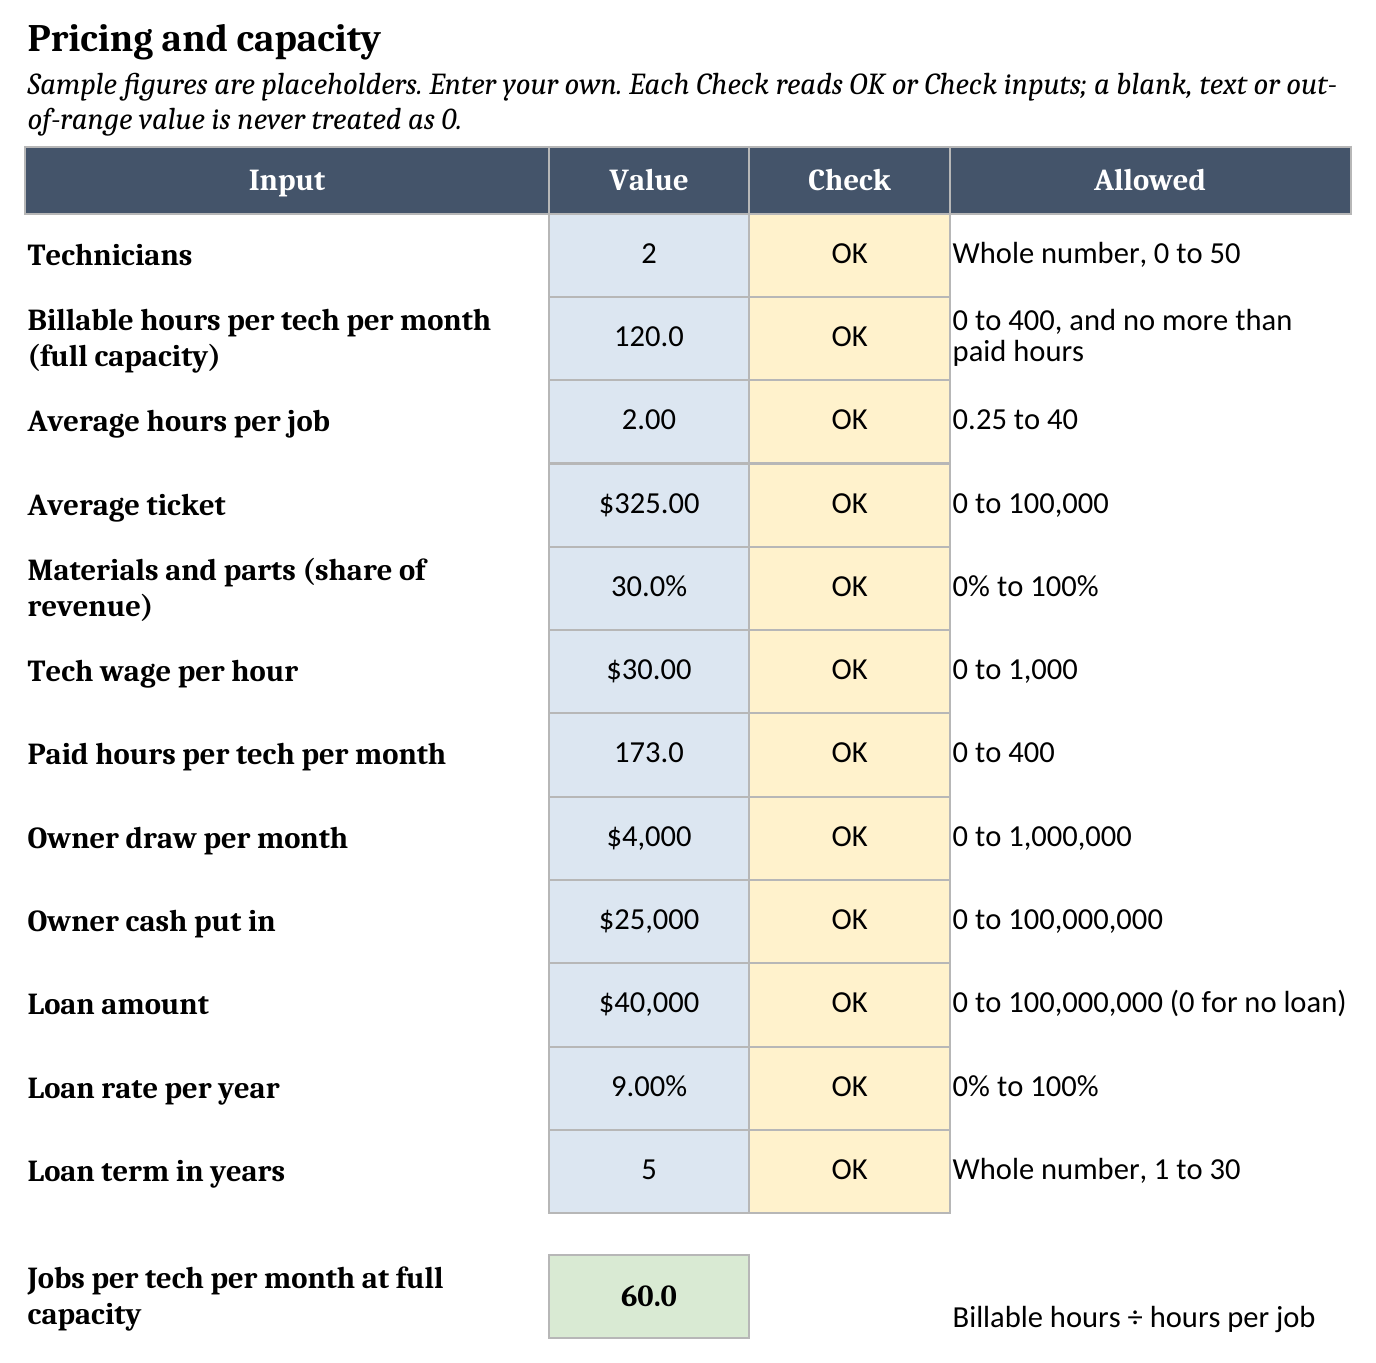
- Pricing and Capacity holds the settings that drive the plan: technicians, billable hours, hours per job, average ticket, materials share, wage, paid hours, owner draw, owner cash and the loan.
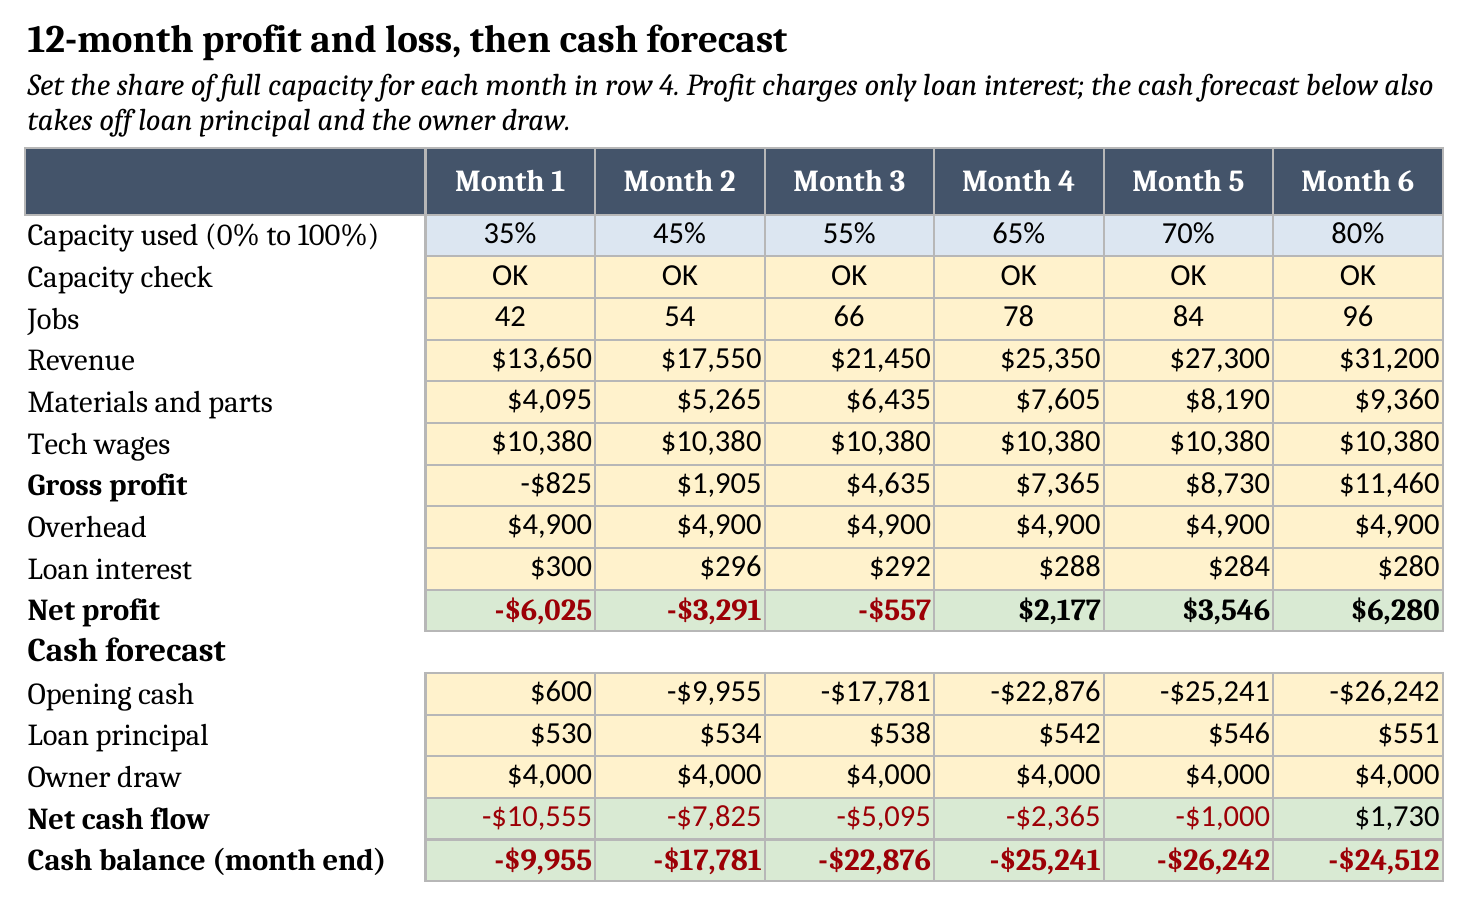
- 12-Month Profit and Loss runs months 1 to 12: jobs, revenue, materials, wages, gross profit, overhead, loan interest and net profit, then the cash forecast underneath.
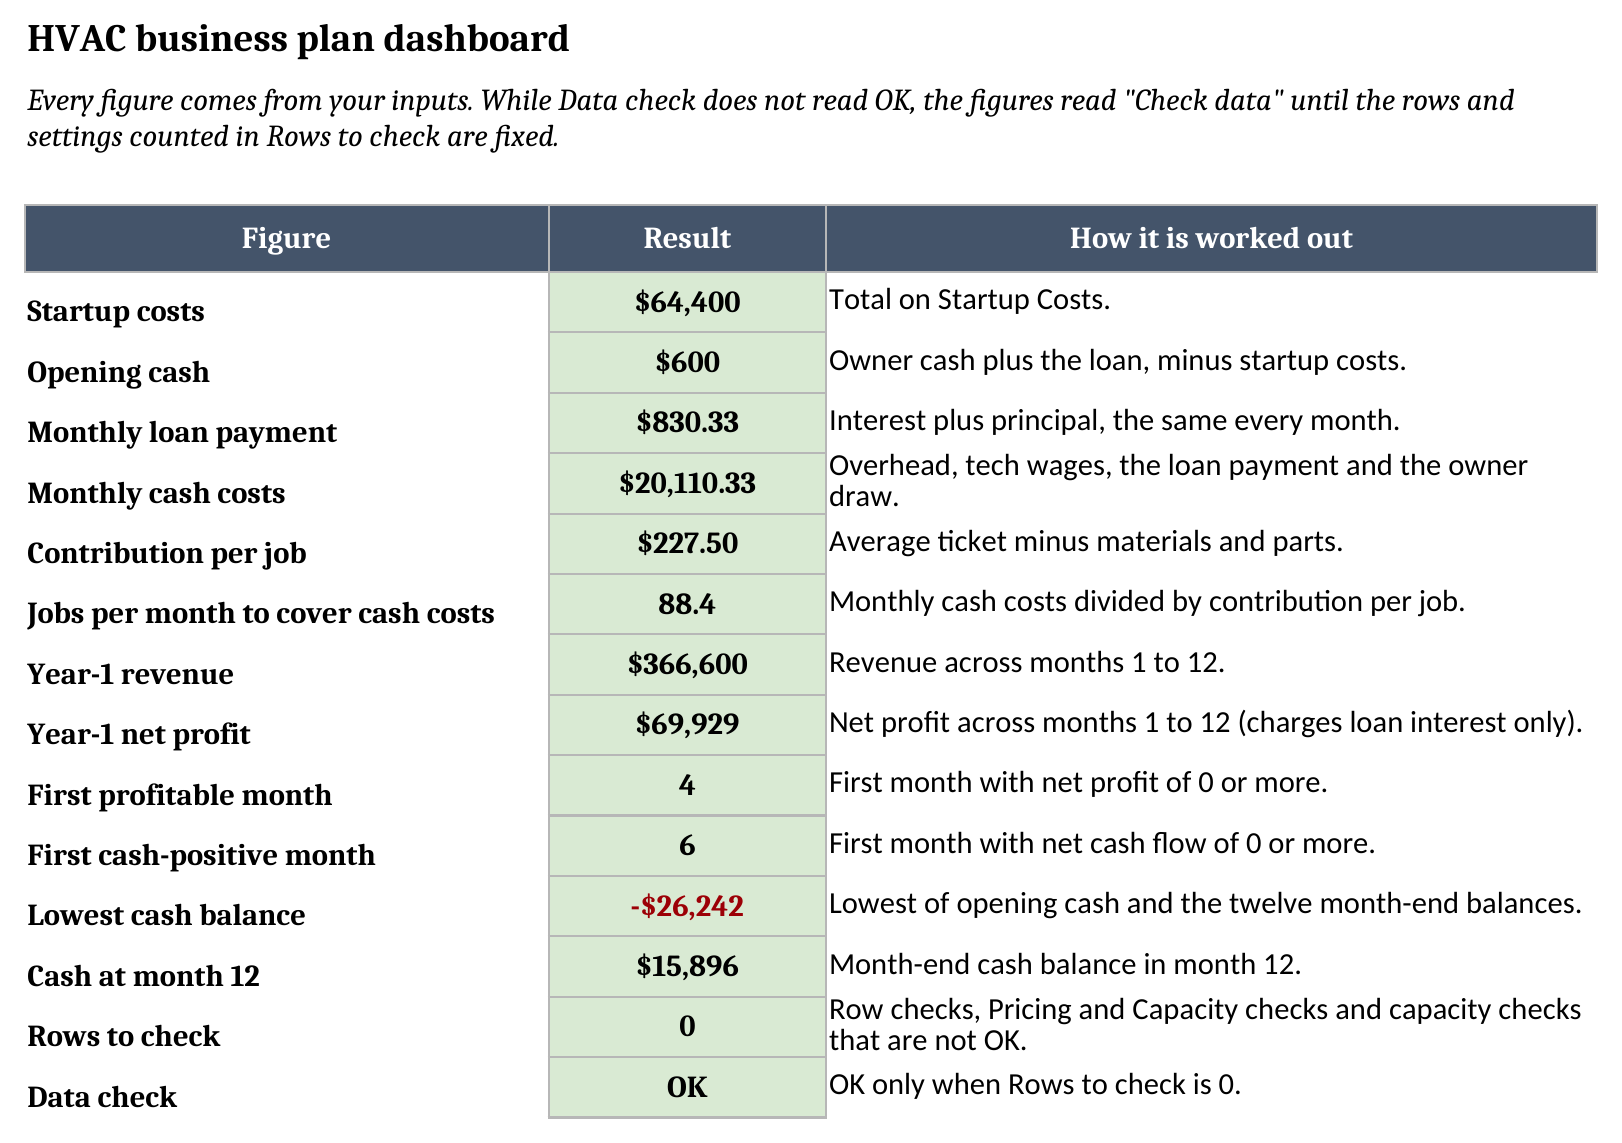
- Dashboard pulls out the figures a plan needs: startup costs, opening cash, the loan payment, monthly cash costs, jobs to cover them, year-1 revenue and profit, the first profitable and first cash-positive months, the lowest cash balance and cash at month 12.
Blue cells are for typing, yellow cells calculate, and green cells hold the headline results.
How to set it up
- If your spreadsheet app opens the file read-only, turn on editing so the formulas calculate.
- On Startup Costs, replace the sample items with your own quotes. Pick a category for each one from the dropdown.
- On Overhead, list everything you pay every month whether or not the phone rings. That works out to $4,900 a month in the sample.
- On Pricing and Capacity, enter your own numbers. Every Check cell beside them should read OK.
- On 12-Month Profit and Loss, set the share of full capacity you expect to reach in each month.
- Open Dashboard and confirm Data check reads OK.
How capacity turns into revenue
Revenue starts with how much work your technicians can do. Billable hours per tech per month, divided by the average hours per job, gives jobs per tech at full capacity. The sample has 120 billable hours and 2-hour jobs, so that’s 60 jobs per tech a month.
The P&L has a capacity row where you set the share of full capacity you expect to reach each month. The sample starts at 35% and climbs to 100% by month 8. Jobs for the month are technicians times jobs per tech times that share, and revenue is jobs times the average ticket. With 2 technicians, month 1 comes to 42 jobs and $13,650 of revenue.
Wages don’t follow the ramp: technicians are paid for their paid hours whether or not the work is booked, which is $10,380 a month in the sample, so the early months lose money. Billable hours can’t be set above paid hours, because the plan would then book work nobody is paid to do.
Profit first, then cash
The template keeps profit and cash on separate lines, because a loan and an owner draw affect them differently. The P&L charges only the interest on the loan. In month 1 that’s $300.00. Net profit is gross profit minus overhead minus that interest. In the sample, month 3 still loses -557 and month 4 makes $2,177, so the first profitable month is month 4.
The cash forecast underneath starts from opening cash: owner cash plus the loan, minus startup costs. The sample opens with $600. Each month it adds net profit, then takes off the loan principal ($530.33 in month 1) and the owner draw. Neither of those is an expense, so neither shows up in profit, but both leave the bank account.
So cash can keep falling after the business turns a profit. The first cash-positive month in the sample is month 6, and the lowest cash balance on the way there is -26,242 dollars. A negative low point means the plan needs that much more cash, from savings, a bigger loan or a line of credit, before it opens.
The break-even point
The Dashboard gives break-even as a number of jobs. Monthly cash costs are overhead, tech wages, the loan payment and the owner draw: $20,110 in the sample. Each job contributes the average ticket minus materials and parts, which is $227.50. Dividing one by the other gives 88.4 jobs a month to cover cash costs.
Compare that with the jobs the P&L expects each month. Until the ramp reaches it, the business is living on its opening cash.
Worked example from the sample data
The sample is a two-technician startup with one used van and a $64,400 startup budget. Every figure in it is made up. Here’s how the year goes:
| Month | Revenue | Net cash flow ($) |
|---|---|---|
| Month 1 | $13,650 | -10,555 |
| Month 6 | $31,200 | 1,730 |
| Month 12 | $39,000 | 7,190 |
And the Dashboard:
| Figure | Result |
|---|---|
| Startup costs | $64,400 |
| Opening cash | $600 |
| Monthly loan payment | $830.33 |
| Jobs per month to cover cash costs | 88.4 |
| Year-1 revenue | $366,600 |
| Year-1 net profit | $69,929 |
| First profitable month | 4 |
| First cash-positive month | 6 |
| Lowest cash balance ($) | -26,242 |
| Cash at month 12 | $15,896 |
The year ends with a profit and $15,896 in the bank, but only after the balance dips below zero. In this sample, the owner would need to line up that extra cash before opening. Try a higher average ticket, a third technician or a faster ramp, and you’ll see the first profitable month, the first cash-positive month and the low point all move at once.
The data checks
The template checks its inputs. Every Startup Costs and Overhead row ends with a Row check that reads OK or Check inputs: an item with no cost, a cost out of range, or a category that isn’t on the list. Every setting on Pricing and Capacity has its own Check, and so does each month’s capacity. The Dashboard counts everything that isn’t OK in Rows to check. Until that count is 0, the P&L lines and every Dashboard figure read Check data instead of a number that quietly treats a blank as zero.
Using it with other tools
Our labor rate calculator and flat-rate price book works out the hourly rate and flat prices that feed a realistic average ticket. Once the company is running and you’re weighing software, the field service software readiness quiz helps you decide whether it’s time, and the field service software ROI calculator estimates what it would pay back. For more on how software fits an HVAC company, see our field service software for HVAC companies page, and browse the rest of our free field service templates.
Limitations
This is a planning model, not accounting software, and it isn’t tax, legal or financing advice. It treats revenue as cash in the month of the job, so it doesn’t model customers who pay late. It doesn’t model taxes, depreciation, seasonal swings beyond the capacity you set, or more than one loan. Wages are a flat monthly figure per technician. Startup Costs and Overhead hold rows 3 to 51.
The workbook opens as a plain .xlsx file. Most spreadsheet apps can import it, and the Instructions sheet includes import steps.
Download the HVAC business plan template and replace the sample figures with your own quotes.