

Most service managers can say who their best technician is. Fewer can show it with numbers from the same week, measured the same way for everyone. Our field service KPI template is a free workbook that turns a plain job log and a weekly hours sheet into first-time fix rate, callback rate, MTTR, utilization and revenue for each technician and for the team, for whatever dates you pick.
Download the field service KPI template. It’s a plain .xlsx with no macros, no external links and no sign-up. Replace the sample technicians, jobs and hours with your own, set your own targets, and the Dashboard recalculates.
Video walkthrough
This short captioned walkthrough moves through the job log and the weekly hours, then shows how the Dashboard scores each technician.
Who this tracker is for
We built it for owners and service managers at small and mid-sized field service companies who want a weekly or monthly scorecard but aren’t ready to buy software for it. If your job records already sit in a spreadsheet, or you can export them from your scheduling tool, you have most of what it needs.
It answers a short list of questions:
- How often did each technician fix the problem on the first visit?
- How many jobs came back as callbacks within 30 days?
- How long does a repair take once the technician starts it?
- How much of the time we paid for did we bill?
- What revenue did each technician bring in over the same window?
For what each KPI means and why it matters, see our guide to field service KPIs, which covers the full list.
What’s in the workbook
There are five sheets, in this order:
- Instructions explains setup, defines each KPI with the formula the workbook uses, covers Google Sheets import, and notes that the formulas, layout and sample figures were written from scratch for this file.
- Technicians is the register. Type each technician’s ID and name, one per row, with room for 25 people. A Row check column flags a blank or repeated ID.
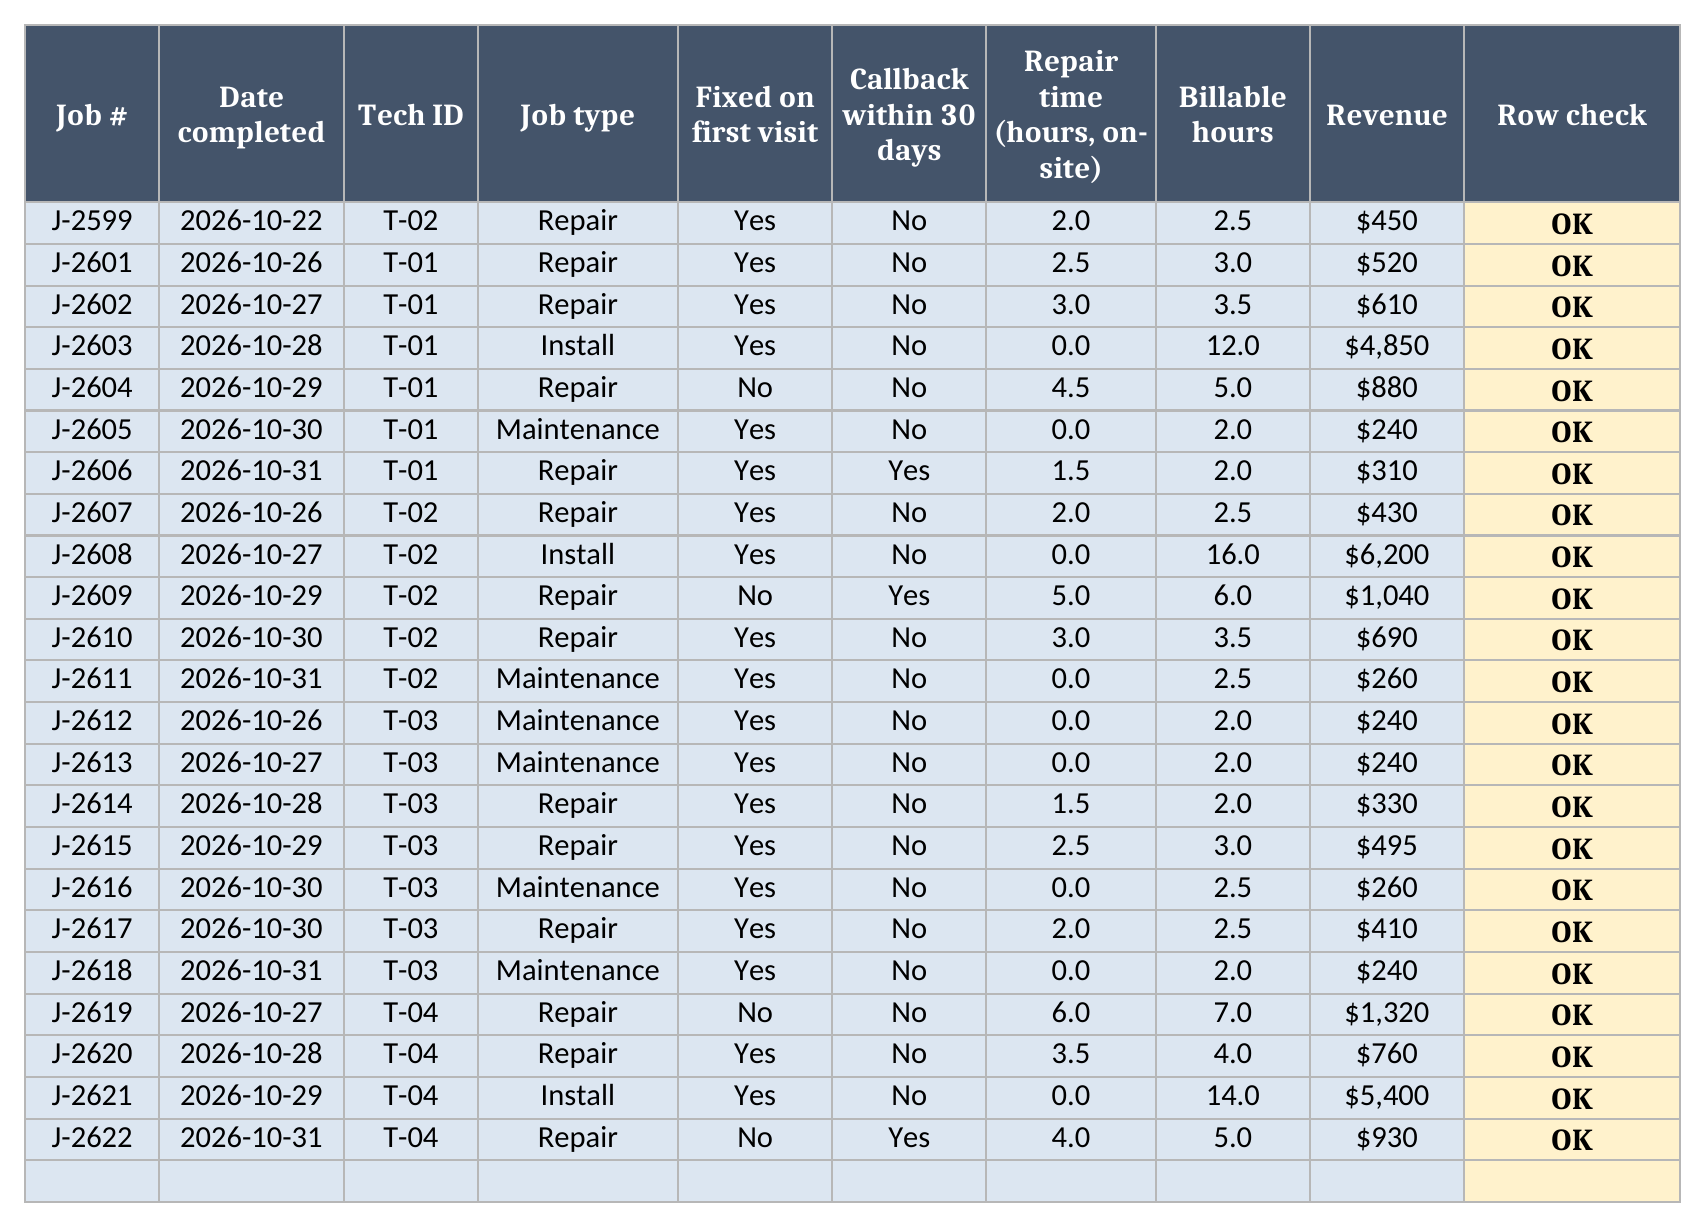
- Jobs holds one row per completed job: job number, date completed, technician ID, job type, whether it was fixed on the first visit, whether it drew a callback within 30 days, on-site repair time, billable hours and revenue. It holds up to 1,000 jobs, and each row gets its own Row check.
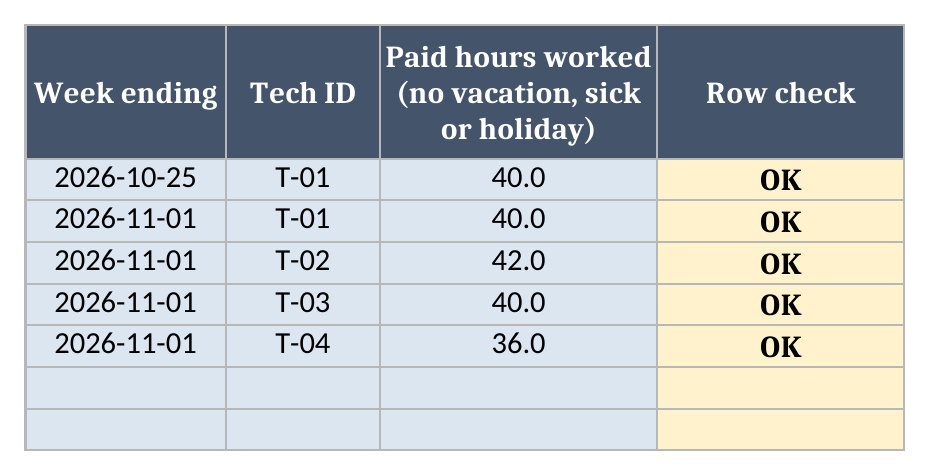
- Hours holds one row per technician per pay week: the week-ending date, the technician ID and the paid hours worked that week. Leave out paid vacation, sick and holiday hours. A repeated technician and week pair is flagged, so a pasted week can’t be counted twice.
- Dashboard is where you set the date range and your targets. It shows team totals at the top and a row for each technician below, with a Flags column counting how many targets that technician missed.
The cells you type into are shaded. Everything else is a formula, so you don’t need to touch it.
How to set it up
- Open the workbook. If your spreadsheet app opens it read-only, turn on editing.
- On Technicians, replace the four sample people with your own. Use whatever IDs you already use, such as payroll numbers or employee codes. The Tech ID dropdowns on the other sheets read from this list.
- On Jobs, clear the sample rows and paste or type your completed jobs. Pick the technician from the dropdown and the job type from Repair, Maintenance, Install or Inspection. Fill in repair time only for Repair jobs.
- On Hours, add one row per technician for each pay week.
- On Dashboard, type a From date and a To date, then your four targets.
- Check Rows to check on the Dashboard. If it’s above zero, find the rows on Technicians, Jobs or Hours whose Row check isn’t OK and fix them.
The glossary entry for MTTR starts the clock when the fault is reported. This workbook measures on-site repair time, from the start of the repair to the equipment working again, including diagnosis, parts waits on the job and testing. That keeps dispatch delays out of the number. If you’d rather include response delay, log repair time from the report time instead, and do it the same way on every row so technicians stay comparable.
How the date range drives every KPI
The From and To dates on the Dashboard are the main control. Every job dated inside the range counts, and so does every Hours row whose week-ending date falls inside it. Move the dates and every KPI recalculates for that window from the same job log, so one file can cover a single week or a whole quarter.
Since paid hours are logged by week, the range should cover whole pay weeks. If your weeks end on Sunday, a range from a Monday to a Sunday matches them. The Dashboard shows which week-ending dates it counted, so a range that cuts a week in half is easy to spot.
The sample covers the week from 2026-10-26 to 2026-11-01, with one older job and one older pay week left in on purpose. With the range set to that week, the Dashboard ignores both. Start the range a week earlier and they come back in.
Why utilization uses paid hours
Utilization here is billable hours divided by paid hours worked, which matches how our glossary defines workforce utilization rate against available hours. Paid hours show what unbilled time costs you: the drive time, shop time and waiting that someone is still paying for. If you divided by scheduled hours or job hours instead, the gaps between jobs would drop out of the number.
That is also why paid hours get their own sheet. A technician who bills well under half of a paid week has a utilization problem the job log alone can’t show.
First-time fix rate follows the first-time fix rate definition: jobs marked as fixed on the first visit, divided by all jobs in the range. Callback rate is jobs marked with a callback within 30 days, divided by the same job count.
Worked example from the sample data
All of the figures below come from the sample data, which is made up. The sample targets are a first-time fix rate of at least 80.0%, a callback rate of at most 10.0%, utilization of at least 65.0% and MTTR of at most 4.0 hours. They’re placeholders, so swap in targets based on your own history.
| Team KPI | Sample result |
|---|---|
| Jobs | 22 |
| First-time fix rate | 81.8% |
| Callbacks | 3 |
| Callback rate | 13.6% |
| MTTR (hours) | 3.2 |
| Billable hours | 104.0 |
| Paid hours | 158 |
| Utilization | 65.8% |
| Revenue | $26,655.00 |
| Revenue per technician | $6,663.75 |
| KPI flags | 6 |
Per technician:
| Tech | Jobs | First-time fix | Callback rate | MTTR (hours) | Utilization | Flags |
|---|---|---|---|---|---|---|
| T-01 D. Reyes | 6 | 83.3% | 16.7% | 2.9 | 68.8% | 1 |
| T-02 M. Okafor | 5 | 80.0% | 20.0% | 3.3 | 72.6% | 1 |
| T-03 J. Patel | 7 | 100.0% | 0.0% | 2.0 | 40.0% | 1 |
| T-04 S. Kim | 4 | 50.0% | 25.0% | 4.5 | 83.3% | 3 |
The sample is set up so the numbers pull against each other. S. Kim has the highest utilization on the team and also misses 3 targets, with a first-time fix rate of 50.0% and a callback rate of 25.0%. J. Patel fixed everything on the first visit, but at 40.0% utilization, most of the paid week went unbilled. Because one KPI can look good while another slips, the Dashboard counts each technician’s misses across all four targets.
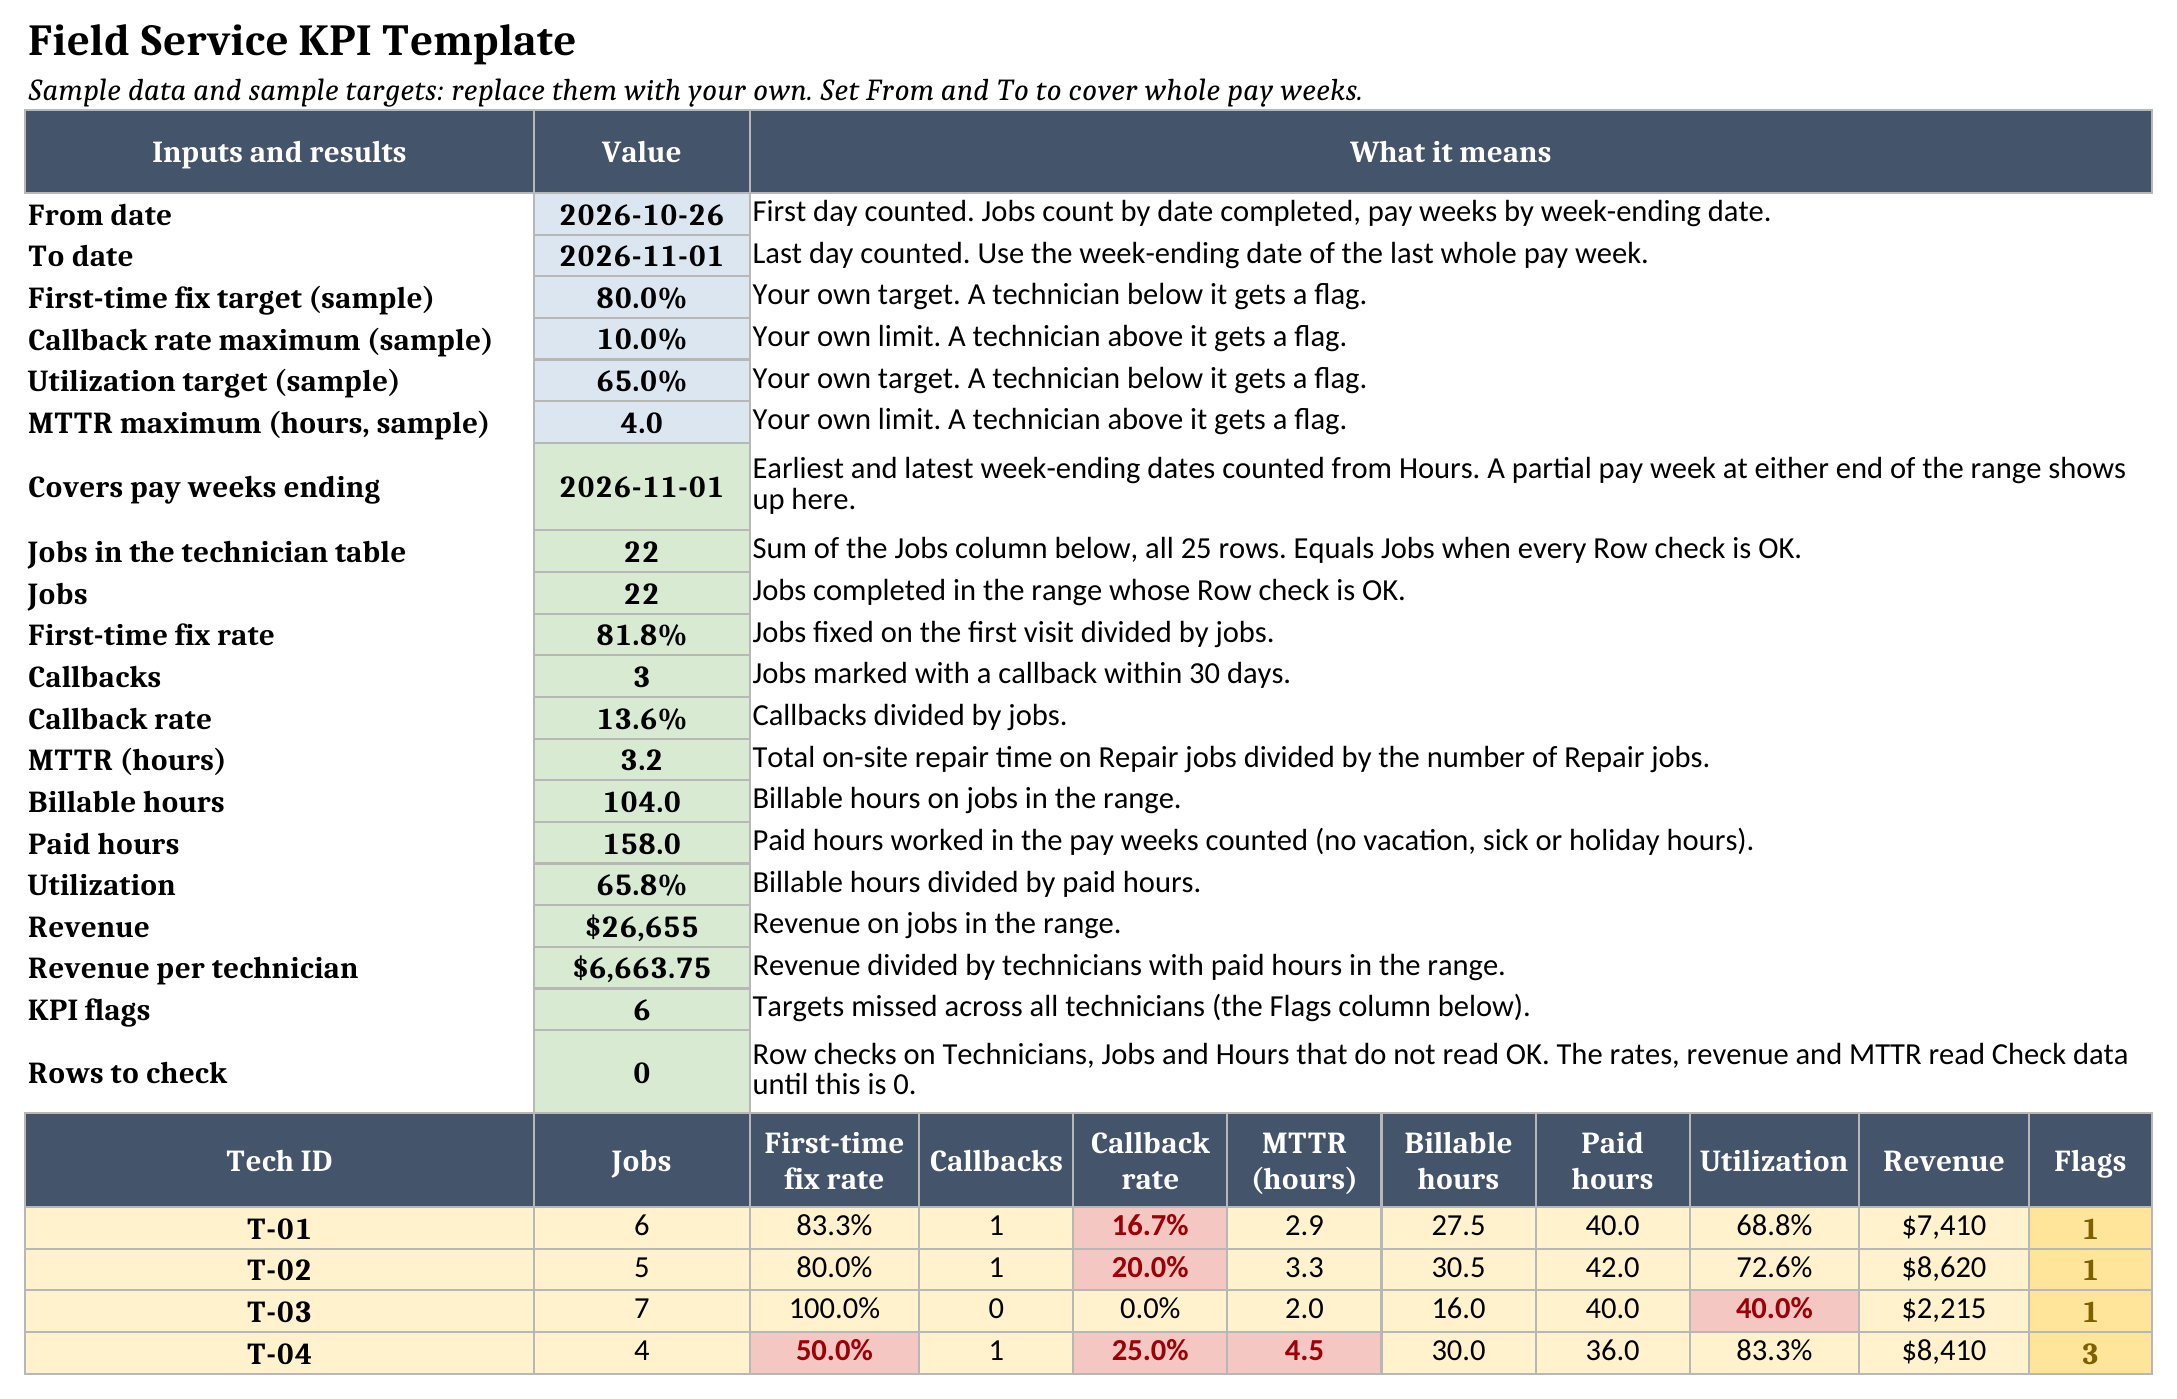
If a ratio has nothing to divide by, such as MTTR for a technician with no Repair jobs in the range, the cell reads “n/a” rather than zero, and “n/a” never counts as a missed target. If any Row check is not OK, the team ratios read “Check data” until you fix the rows, so a duplicate pay week or a mistyped ID shows up before it skews the totals.
How to use it in Google Sheets
Google Sheets can import an .xlsx file. These are the usual steps; check that the Dashboard figures look right after you import:
- Download the .xlsx file.
- In Google Sheets, open File > Import > Upload and choose the file.
- Pick Create new spreadsheet or Replace spreadsheet.
- Confirm the Dashboard shows numbers, then replace the sample data.
Where it fits with our other KPI resources
The field service KPIs guide explains the wider set of metrics service companies track and why. This template takes five of them and gives you a place to measure them from your own records. The glossary entries for first-time fix rate, MTTR and workforce utilization go deeper on each definition.
If you’re weighing field service software, a few months of these numbers make a better starting point for the FSM ROI calculator than guesses. You’ll find more workbooks on the free field service templates page.
Limitations to know before relying on it
- It reads what you type. Whether a job counts as fixed on the first visit, or a return trip as a callback, depends on how your team marks it, so agree on the rules before comparing technicians.
- Callbacks are marked on the original job. The workbook doesn’t link a callback visit back to its first job.
- Paid hours come in weekly, so a range that splits a pay week counts that week whole or not at all, depending on its end date.
- It holds 25 technicians, 1,000 jobs and 200 pay-week rows. Past that, start a new file for each period.
- There’s no history chart. To compare months, change the dates and copy the figures somewhere else.
- Nothing updates on its own. Someone has to keep the job log and hours current.
Once logging becomes a daily chore for several people, that’s a sign the scorecard should come from your scheduling and job records directly.
Until then, grab the field service KPI template, load last month’s jobs and hours, and see which targets each technician hits.