

A crew about to start a risky job usually talks it through first. Our job safety analysis template puts that conversation on paper and scores it. List the job’s steps, name the hazard in each one, and score it by likelihood and severity before and after controls. The workbook works out every risk score, rates it against bands you set, plots each step on a 5x5 risk matrix, and keeps the crew sign-off and a toolbox talk attendance log in the same file.
Download the job safety analysis template. It’s a plain .xlsx with no macros and no sign-up. The sample job is a rooftop compressor replacement, so you can see every score and count working before you clear it and write up your own.
Video walkthrough
This short captioned walkthrough covers the JSA sheet, the risk matrix and the toolbox talk log.
What a job safety analysis is
A job safety analysis, often shortened to JSA and also called a job hazard analysis (JHA), takes one job and breaks it into the steps a technician actually performs. For each step you ask what could hurt someone, then decide what will prevent it or make it less serious. OSHA’s publication 3071, Job Hazard Analysis, explains the method in detail and is the best place to start if your company hasn’t written one before.
The JSA template follows that step, hazard and control layout and adds a score. The 1-to-5 likelihood and severity scales, the bands and the matrix are this template’s own way of ranking hazards. They’re a planning aid for your crew and aren’t drawn from any regulation.
Who this template is for
It’s built for field service and mechanical contractors who send small crews into non-routine work: a compressor swap on a roof, a boiler tear-down, a lift with a crane, a panel change in an occupied building. It also suits a service manager or safety lead who reviews the crew’s JSA before the job starts and wants the same format every time.
The template answers a few questions about one job:
- Which steps carry the worst hazards before anyone does anything about them?
- Do the controls you wrote down bring each score down, and by how much?
- Which hazards are still rated High or Extreme with the controls in place?
- Who on the crew has reviewed and signed the JSA?
What’s in the workbook
There are six sheets, in this order:
- Instructions covers setup, the color legend, the limitations, and a note that the formulas, layout and sample figures were written from scratch for this file.
- JSA holds the job header (job, location, date and who prepared it) and up to 50 steps. Each step has a task, a hazard, a likelihood and severity before controls, the controls, and a likelihood and severity after controls. The risk scores, ratings and Row check are calculated.
- Risk Matrix is where you set the rating bands. It shows two 5x5 grids that count how many steps sit at each likelihood and severity, one before controls and one after.
- Sign-off lists everyone who reviewed the JSA, with their company or role, the date and whether they signed.
- Toolbox Talks logs each safety briefing: the date, topic, presenter, number of attendees and whether a sign-in sheet was kept.
- Dashboard pulls it together: steps analyzed, high or extreme hazards before and after controls, average scores, the risk-score reduction, sign-off, talk attendance and the data checks.
Blue cells are for typing and yellow cells calculate. The Dashboard results are green.
How to fill in a JSA
- On JSA, type the job, the location, the date and your name.
- Clear the sample steps and list your job’s steps in the order the crew will do them. Keep each step short: “remove access panels,” not a paragraph. A step with two separate hazards takes two rows.
- For each hazard, score likelihood and severity before controls, each a whole number from 1 (lowest) to 5 (highest).
- Write the controls. Then score likelihood and severity again as if those controls are in place.
- On Risk Matrix, check the three band limits. The sample uses 4, 9 and 14.
- Fill in Sign-off before the work starts, and log each toolbox talk on Toolbox Talks as you hold it.
- Fix any Row check that doesn’t read OK, then read the Dashboard.
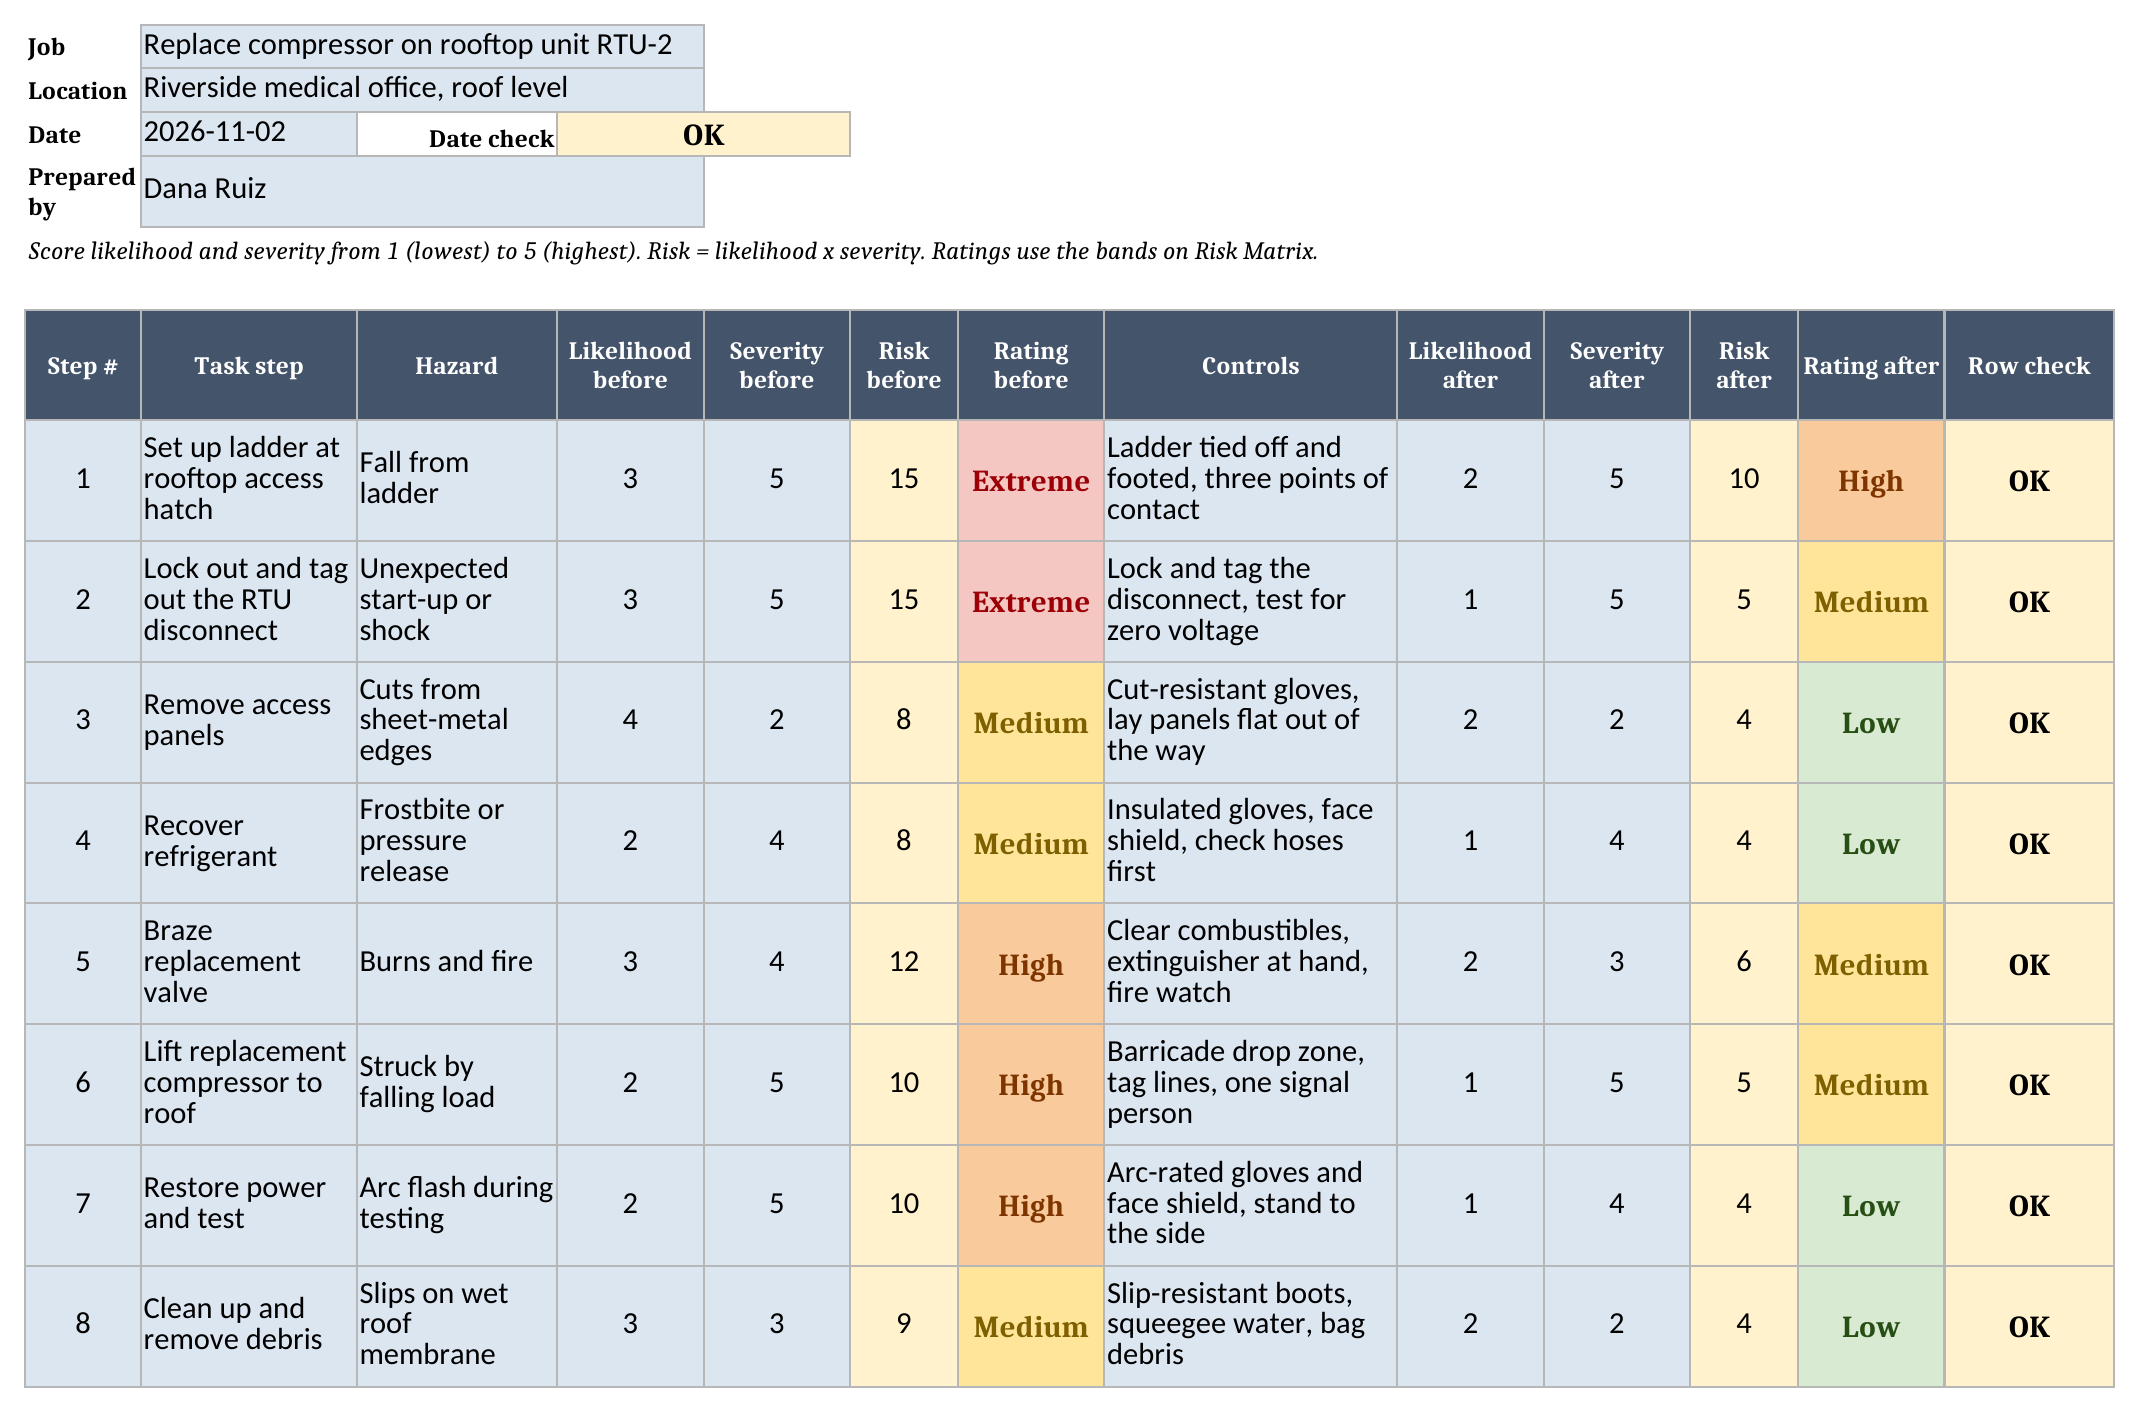
Row check catches the mistakes that would throw off the totals. Check inputs means the step number, task or hazard is blank, or one of the four scores is missing or isn’t a whole number from 1 to 5. Add controls means a step has a hazard and scores but no controls written. Check scores means the score after controls is higher than the score before, which usually means the two were typed the wrong way round. Every one of those adds to Rows to check on the Dashboard, and the figures there read “Check data” until it’s back to zero.
How the risk score works
Each hazard gets two numbers. Likelihood is how likely the hazard is to hurt someone on this job. Severity is how bad the harm would be. Both run from 1 to 5, and the risk score is likelihood times severity, so it runs from 1 to 25.
The score turns into a rating through the three limits on the Risk Matrix sheet. With the sample bands, a score up to 4 rates Low, up to 9 rates Medium, up to 14 rates High, and anything above that rates Extreme. Change a limit and every rating on the JSA, every matrix color and the Dashboard counts follow it. The limits have to be whole numbers from 1 to 24, each higher than the one before. If they aren’t, Bands check on Risk Matrix says so and the Dashboard holds its figures at “Check data.”
Take the first sample step, setting up a ladder at the rooftop hatch. A fall from a ladder onto a roof deck could be serious, so severity stays high whether or not controls are in place. Before controls, the score is 15, which rates Extreme. Tying the ladder off and having a second tech foot it lowers the likelihood but not the severity, so the score after controls is 10, still High. It stays in the warm colors on the matrix, so it’s the step a supervisor should look at first.
Lockout and tagout on the unit’s disconnect is different. It starts at 15, but locking, tagging and testing for zero voltage cut the likelihood to the bottom of the scale, so the score after controls is 5. Severity stays at the top of the scale because a shock would be just as serious; the controls only make one less likely.
Reading the risk matrix
The Risk Matrix sheet has two grids. Likelihood runs down the side from 1 at the top to 5 at the bottom, and severity runs across from 1 on the left to 5 on the right. Each cell counts the steps scored at that likelihood and severity, and its color is the band that cell’s score falls in.
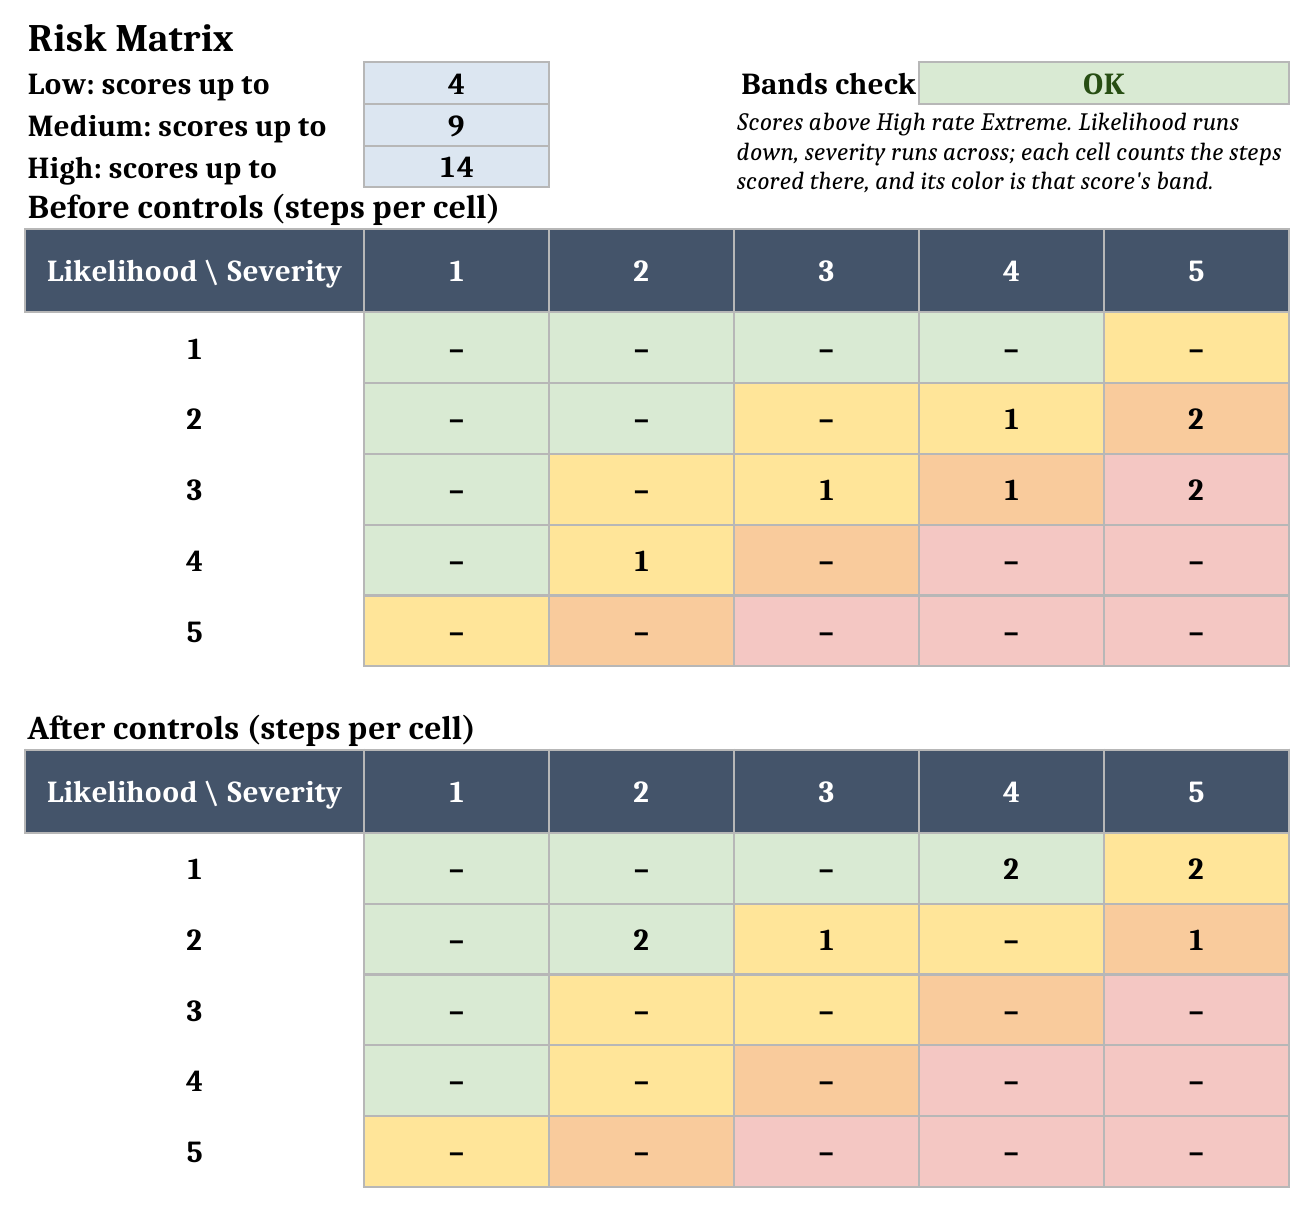
Compare the two grids and you can see what your controls did. Before controls, 2 steps sit at likelihood 3, severity 5, and 2 more at likelihood 2, severity 5. After controls, those steps have moved up the grid: 2 sit at likelihood 1, severity 5. Steps whose severity also fell move left as well, and 2 steps end up at likelihood 2, severity 2. A step that stays in the same cell after controls is a step where the controls on paper didn’t change the score.
Worked example: a rooftop compressor replacement
The sample JSA covers 8 steps for replacing the compressor on a rooftop unit: ladder setup, lockout, panel removal, refrigerant recovery, brazing, the crane lift, start-up and clean-up. Every figure is a sample input to replace. The Dashboard works out:
| Measure | Result |
|---|---|
| Steps analyzed | 8 |
| High or extreme before controls | 5 |
| High or extreme after controls | 1 |
| Average risk before | 10.88 |
| Average risk after | 5.25 |
| Risk-score reduction | 51.7% |
| Highest residual score | 10 |
| Sign-off complete | 75.0% |
| Toolbox talks logged | 3 |
| Talk attendees | 18 |
| Rows to check | 0 |
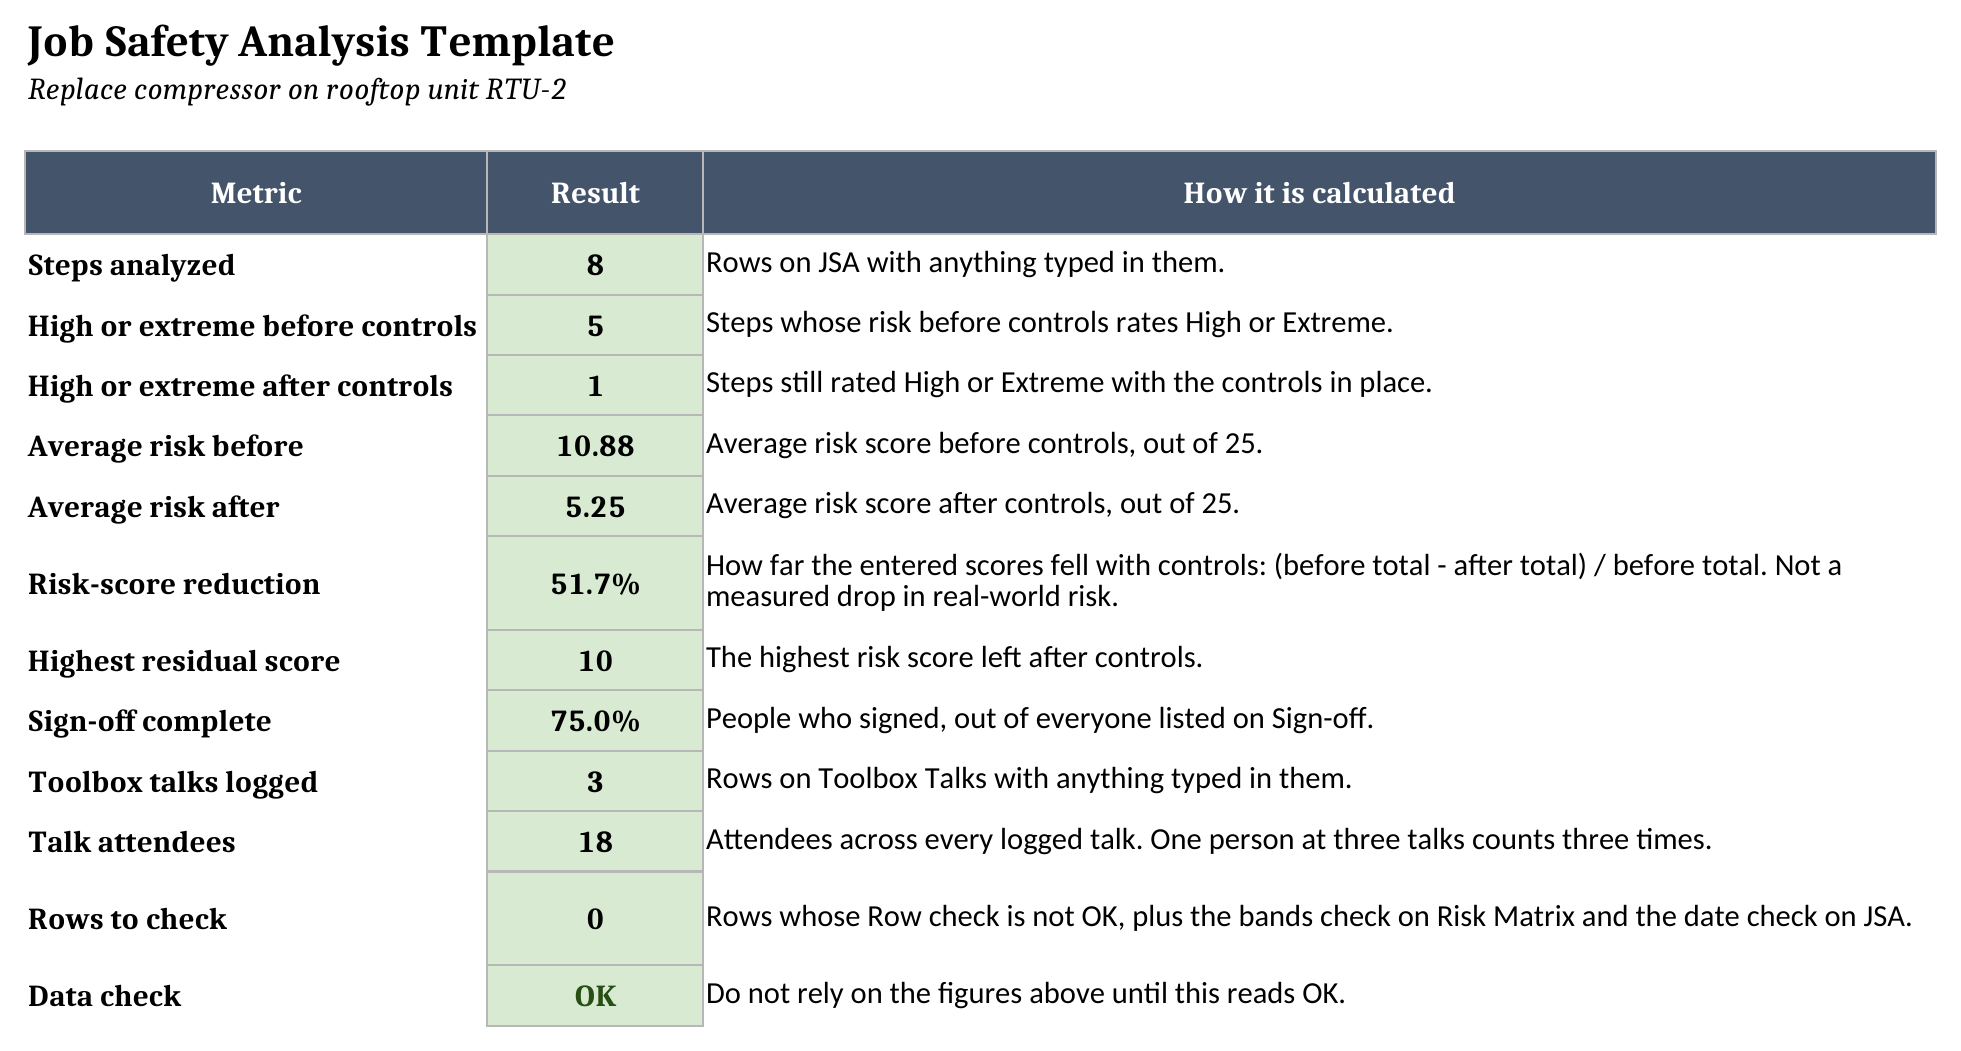
5 of the 8 steps start out High or Extreme. With the controls in place, the count drops to 1: the ladder setup, which keeps the highest residual score at 10. Brazing the replacement valve shows a middle case. It starts at 12 (High) and the fire watch and cleared combustibles bring it to 6 (Medium).
The risk-score reduction of 51.7% compares the total of the scores entered before controls with the total after. It tells you how much the crew’s own scoring moved, which is useful for comparing one JSA with the next. It isn’t a measured drop in injuries or real-world risk, and it’s only as good as the scores typed in.
Sign-off complete reads 75.0% because one of the four people listed, the apprentice, hasn’t signed yet.
Sign-off and toolbox talks
The Sign-off sheet needs a name, a date and Yes or No for signed on every row. Company or role is optional, which is handy for a subcontractor like the crane operator in the sample. Print the JSA and Sign-off sheets together if your crew signs on paper.
Toolbox Talks is a running log of the short safety briefings you hold. Each row needs a date, a topic, a presenter, the number of attendees (a whole number from 0 to 500) and Yes or No for whether a sign-in sheet was kept.

The sample logs 3 talks with 18 attendees in total. That total counts attendance, not people, so a technician who sat in on all three talks counts three times.
How it fits with our other templates
A JSA covers one job. A few other documents sit around it:
- The HVAC employee handbook template is where your company’s standing safety rules and expectations live. The JSA applies those rules to one specific job.
- A safety compliance checklist covers the recurring checks a site or vehicle needs. The JSA covers the hazards of a single task.
- The job hazard analysis (JHA) glossary entry explains the term and where it overlaps with a JSA.
You’ll find the rest of the set on our free field service templates page.
Limitations to know before relying on it
- The scores are your crew’s judgment. The template checks that they’re whole numbers from 1 to 5 and that the score after controls isn’t higher than before. It can’t tell you whether a control is adequate.
- The bands, scales and matrix are this template’s own method. The workbook is a planning record. It isn’t a form any regulator, customer or general contractor issues, and it doesn’t tell you which rules apply to your work.
- One JSA sheet holds one job with up to 50 steps. Copy the sheet for another job, but the Risk Matrix and Dashboard read only the original JSA sheet.
- Sign-off and Toolbox Talks hold 200 rows each. There are no electronic signatures, and nothing is sent to the office or synced between crews.
Grab the job safety analysis template, clear the sample job, and write up your next one before the crew heads out.