

Most service shops set their hourly rate by looking at the wage, adding something that feels safe, and checking it against what the shop down the road charges. But the wage is only part of what an hour costs, and a tech bills only some of the hours you pay for. Our labor rate calculator works the rate out from your own numbers instead, then uses it to price a flat-rate price book, task by task.
Download the labor rate calculator. It’s a plain .xlsx file with no macros and no sign-up. Replace the sample inputs with yours and the rate and every flat price recalculate.
Video walkthrough
This short captioned walkthrough goes from the rate inputs to the price book and the parts list.
Who this calculator is for
We built it for owners and service managers at HVAC, plumbing, electrical and other trade shops who price repair work by the hour or by the task. It fits two situations in particular:
- You’re setting or reviewing your hourly rate and want to see what it has to cover, line by line.
- You’re moving from time-and-materials billing to flat-rate pricing and need a price book that traces back to a rate you can defend.
The workbook carries no wage data, typical rates or regional benchmarks. Every number in it is a sample input for you to replace.
What’s in the workbook
There are four sheets, in this order:
- Instructions covers setup, the color legend, Google Sheets import, the limitations, and a note that the formulas, layout and sample figures were written from scratch for this file.
- Labor Rate holds your inputs: technicians, average base wage, paid hours per tech, payroll burden, billable share, annual overhead, target net profit and parts markup. Below them it works out annual wages, burden, loaded labor cost, billable hours, labor and overhead cost per billable hour, the break-even rate and the required hourly rate. It also counts valid task rows and rows to check, and totals the price book.
- Price Book has one row per task: a code, the task, labor hours, a part number and quantity. It calculates parts cost, labor price, parts price, the price before rounding, the flat price and a Row check.
- Parts lists your parts with a unit cost and a Row check.
Blue cells are for typing, yellow cells calculate, and green cells hold the headline results.
How to set it up
- Open the file in your spreadsheet app. If it opens read-only, turn on editing so the formulas calculate.
- On Labor Rate, replace the blue inputs with your own: how many techs bill, their average base wage, the hours you pay each one in a year, payroll burden as a percent of wages, the share of paid hours you can bill, annual overhead, the net profit you want as a percent of revenue, and your parts markup.
- Read the break-even rate and the required hourly rate.
- On Parts, list the parts your flat-rate tasks use, with your unit cost. Keep each part number unique.
- On Price Book, list each task with its labor hours. Pick the part from the dropdown and type the quantity, or leave the part blank for a labor-only task.
- Fix any Row check that isn’t OK. A task with a problem shows a dash in Flat price instead of a number.
From wage to required rate
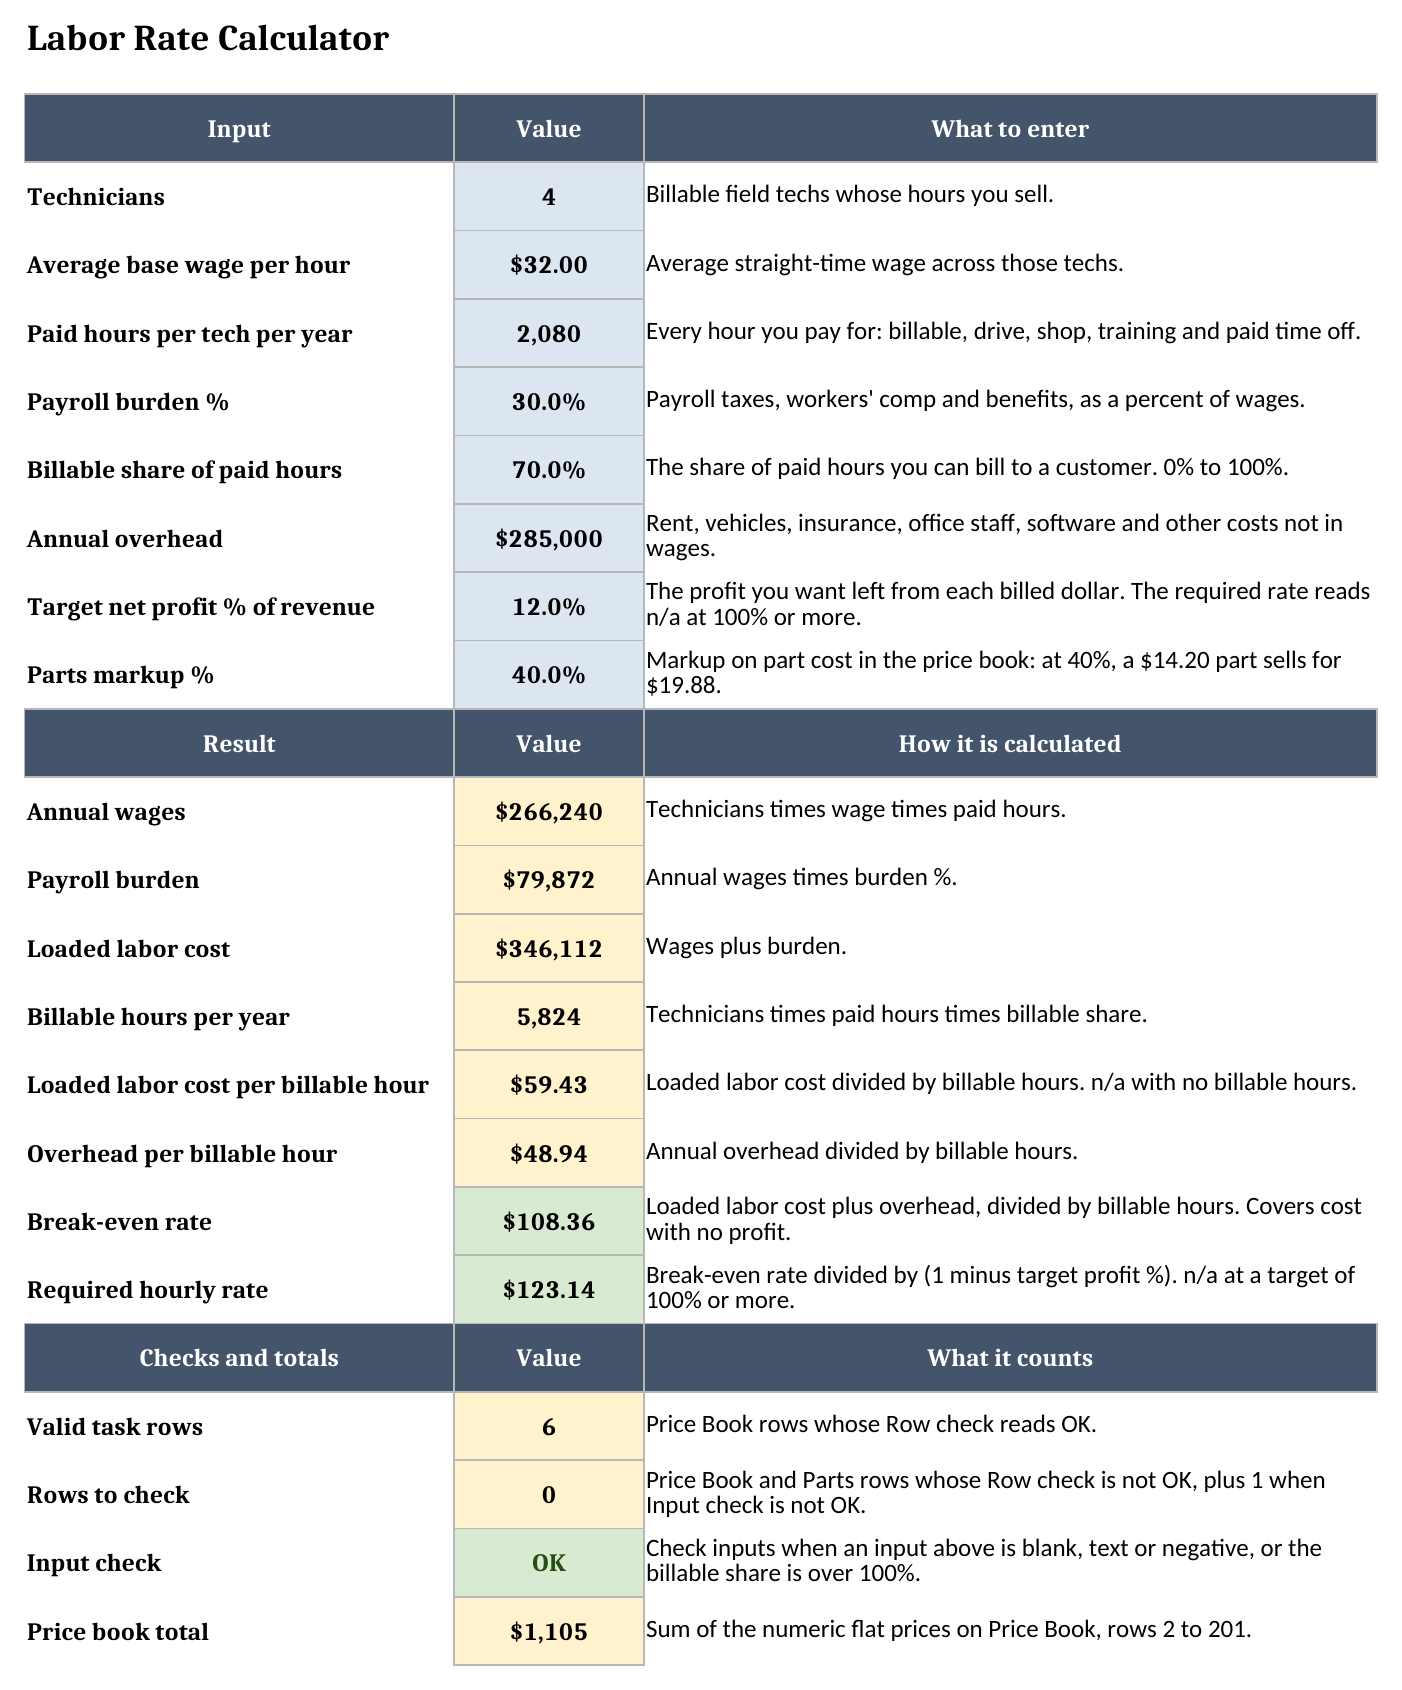
The sample shop has 4 techs at an average base wage of $32.00 an hour, each paid for 2,080 hours a year. That’s $266,240 in wages. Payroll burden at 30.0% adds $79,872, for a loaded labor cost of $346,112.
A tech paid for 2,080 hours doesn’t bill 2,080 hours, because drive time, shop time, callbacks, training and paid time off all come out of them. Quick rate math often leaves this out. The sample assumes a 70.0% billable share, which leaves 5,824 billable hours a year across the shop. Spread over those hours, labor costs $59.43 per billable hour, well above the $32.00 wage.
Overhead goes through the same division. The sample’s $285,000 a year in rent, vehicles, insurance, office staff and software works out to $48.94 per billable hour. Add the two and you get the break-even rate, $108.36. Charge that and the shop covers its costs with nothing left over.
Profit comes last. The sheet divides the break-even rate by one minus the target net profit, which makes the profit a share of what you bill rather than a markup on cost. At a 12.0% target, the required hourly rate is $123.14.
The billable share moves the rate more than anything else on the sheet. Drop it from 70.0% to 60% and the required rate rises to $143.66, because the same costs land on fewer hours. By comparison, raising the average wage from $32.00 to $34 takes the rate to $127.36, and raising overhead to $320,000 a year takes it to $129.97.
If billable hours come out at zero, or the profit target is 100% or more, the rate reads n/a instead of a number. For the wider practice of tracking and adjusting the rate over time, see our glossary entry on labor rate management.
Turning the rate into a flat-rate price book
A flat-rate price book quotes each task at one price, whatever the job actually takes on the day. The customer sees the price up front, and the shop carries the risk of a slow job. That only works if each price traces back to a rate that covers your costs.
Each Price Book row prices its task in four steps:
- Labor price is the task’s labor hours times the required hourly rate.
- Parts cost is the quantity times the unit cost on Parts.
- Parts price is the parts cost marked up by your parts markup, 40.0% in the sample.
- The flat price is labor price plus parts price, rounded up to the next whole dollar.
Change any input on Labor Rate and every flat price reprices from the new rate. Rounding is always up, so the book never quotes below its own math.
The parts markup here is a markup on cost, which isn’t the same thing as a margin. A 40.0% markup is a smaller share of the selling price than it is of the cost. To convert between the two, or to see what margin a given markup leaves, use our markup calculator.
Worked example: six tasks at the sample rate
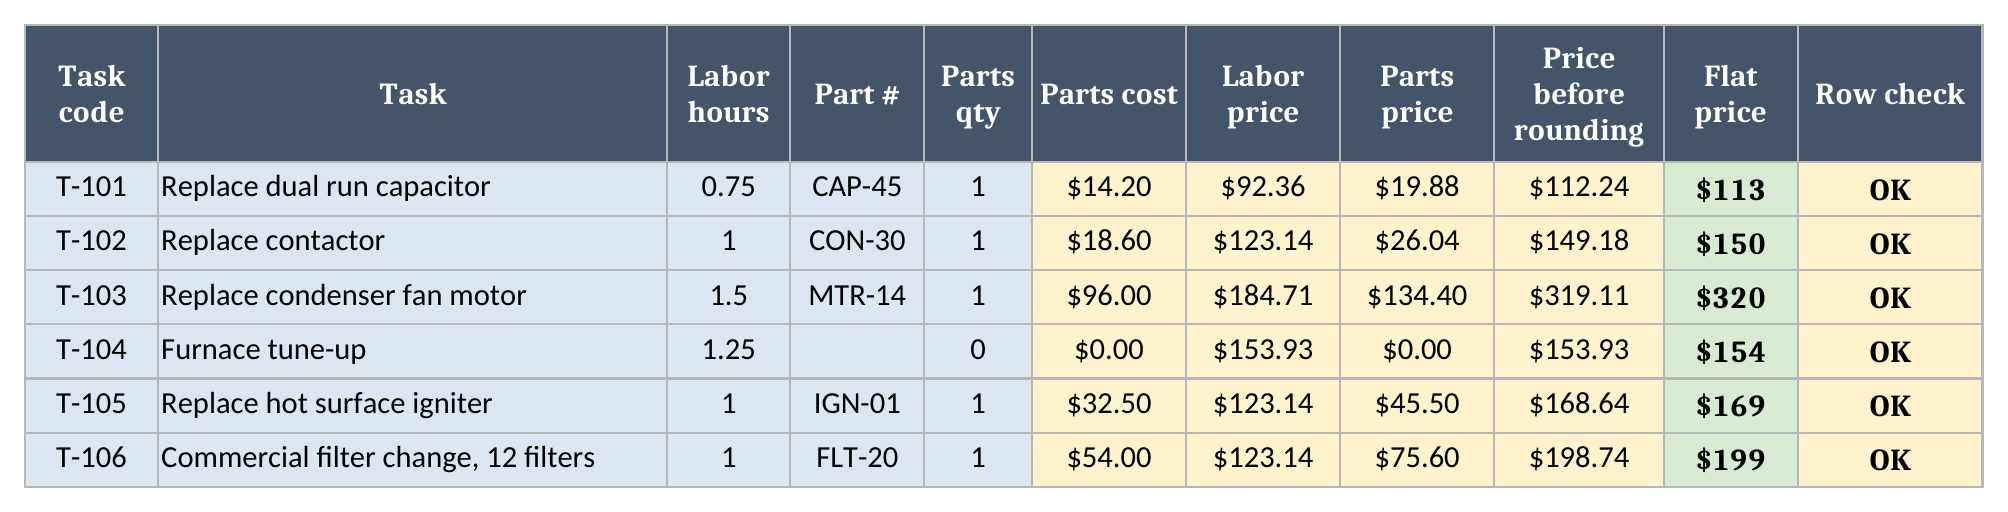
At the required rate of $123.14, the sample price book comes out like this:
| Task | Labor hours | Parts cost | Before rounding | Flat price |
|---|---|---|---|---|
| Replace dual run capacitor | 0.75 | $14.20 | $112.24 | $113 |
| Replace contactor | 1.00 | $18.60 | $149.18 | $150 |
| Replace condenser fan motor | 1.50 | $96.00 | $319.11 | $320 |
| Furnace tune-up | 1.25 | $0.00 | $153.93 | $154 |
| Replace hot surface igniter | 1.00 | $32.50 | $168.64 | $169 |
| Commercial filter change, 12 filters | 1.00 | $54.00 | $198.74 | $199 |
The furnace tune-up is labor only. Its part number is left blank with a quantity of 0, so the row prices on hours alone. All 6 rows pass their checks, and the book totals $1,105. The total only confirms that every row has a price.
These are sample tasks with sample hours. Your book should use the hours your own crews actually take, and those change as crews and equipment change.
The Parts sheet and the row checks
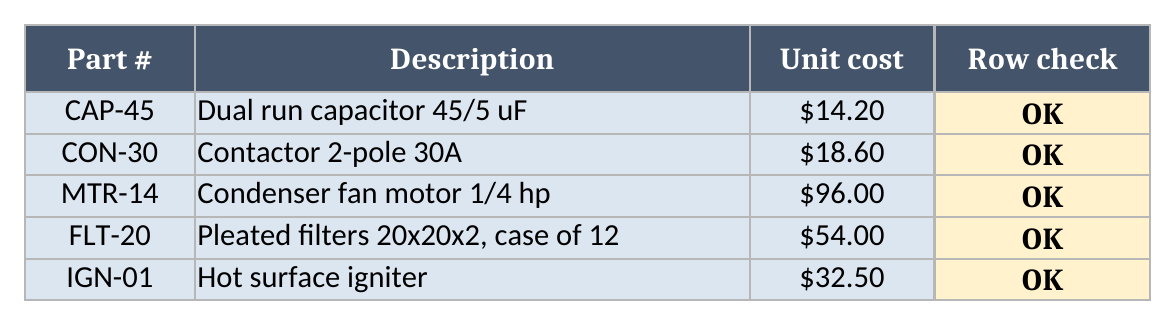
Parts holds one row per part: the part number, a description and your unit cost. The sample capacitor costs $14.20. Price Book looks each part up by its exact part number, so a typo can’t match a different part by accident. A part number that isn’t on Parts, appears there twice, or has a blank, text or negative cost flags the task with Check part and leaves its flat price as a dash.
The other checks work the same way:
- On Price Book, labor hours must be a number of 0 or more, and a quantity above 0 needs a part. Anything else reads Check inputs or Check part.
- On Parts, a row with no part number reads Check ID, and a repeated one reads Duplicate ID on both rows.
- On Labor Rate, Input check reads Check inputs when any input is blank, text or negative, or the billable share is over 100%. While it does, the rate and every flat price read Check data, so a bad input never produces a price.
Rows to check on Labor Rate counts every flag, so one glance tells you whether the book is clean.
Importing into Google Sheets
To bring the file into Google Sheets:
- Download the workbook from the labor rate calculator link.
- Open Google Sheets.
- Choose File > Import > Upload.
- Select the downloaded file.
- Choose Insert new sheet(s), or create a new spreadsheet from the upload.
There are no macros. Formulas, dropdowns and formatting may not carry over exactly, so compare the required rate, the flat prices and the row checks with the original file before you rely on the imported copy.
How it differs from the HVAC bid template
The labor rate calculator answers “what does an hour of our time have to sell for?” and prices repeatable tasks from that answer. Our HVAC bid template prices one commercial job from its line items, with labor by trade at a loaded cost per hour. The two fit together: the loaded labor cost per billable hour from this workbook is the kind of figure that belongs on the bid template’s Rates sheet.
Limitations to know before relying on it
- The required rate is one blended rate for every tech. Overtime, after-hours and trade-by-trade rates aren’t modeled.
- Overhead is recovered on billable hours only, and target profit is a share of revenue, not of cost.
- Parts carry a single markup percent, with no tiers by part cost.
- Sales tax, trip charges and warranty reserves aren’t calculated.
- The workbook holds up to 200 tasks and 100 parts. Formulas, totals and dropdowns stop at row 201 on Price Book and row 101 on Parts.
- It won’t put the price book on a tech’s phone or turn a quote into an invoice.
More free workbooks for service businesses are on the field service templates page.
Download the labor rate calculator, put in your own wages and overhead, and see what an hour of your time has to sell for.