

A technician who opens the van doors and finds the last capacitor already gone loses the job, or at least the afternoon. Our truck stock inventory template keeps a standard stock list for each service van, logs every part used, restocked or moved between vans, and shows which lines to reorder and how many units to order before anyone runs short on site.
Download the truck stock inventory template. It’s a plain .xlsx file with no macros and no sign-up. Replace the sample vans, parts and counts with your own, and on-hand stock, reorder quantities and stock value per van recalculate.
Video walkthrough
This short captioned walkthrough follows a part from the Movements log to the van’s on-hand figure, then shows the reorder flags, the stock value per van and the Dashboard totals, and ends on this page’s address.
Who this template is for
We built it for trade businesses whose technicians carry parts on the truck: HVAC, plumbing, electrical and appliance repair companies running anywhere from two vans to a few dozen. It’s usually kept by whoever restocks the vans, whether that’s an office manager, a parts runner or a lead tech.
A van stock list answers a short set of questions, and this one answers them for each van:
- What should each van carry, and how low should a part get before it’s topped up?
- How much of each part is on each van right now?
- Which lines need reordering, and how many units bring them back to full?
- What is the stock on each van worth?
If you’re new to the idea, our glossary entry on bin stock and van inventory covers why service companies carry stock on the truck in the first place.
What’s in the workbook
There are six sheets, in this order:
- Instructions covers setup, the color legend, the limitations, and a note that every formula, layout choice and sample figure was written from scratch for this file.
- Vans lists each van with its Van ID and technician. The sheet works out the stock value on that van and its lines to reorder.
- Parts is your parts list: Part #, description and unit cost.
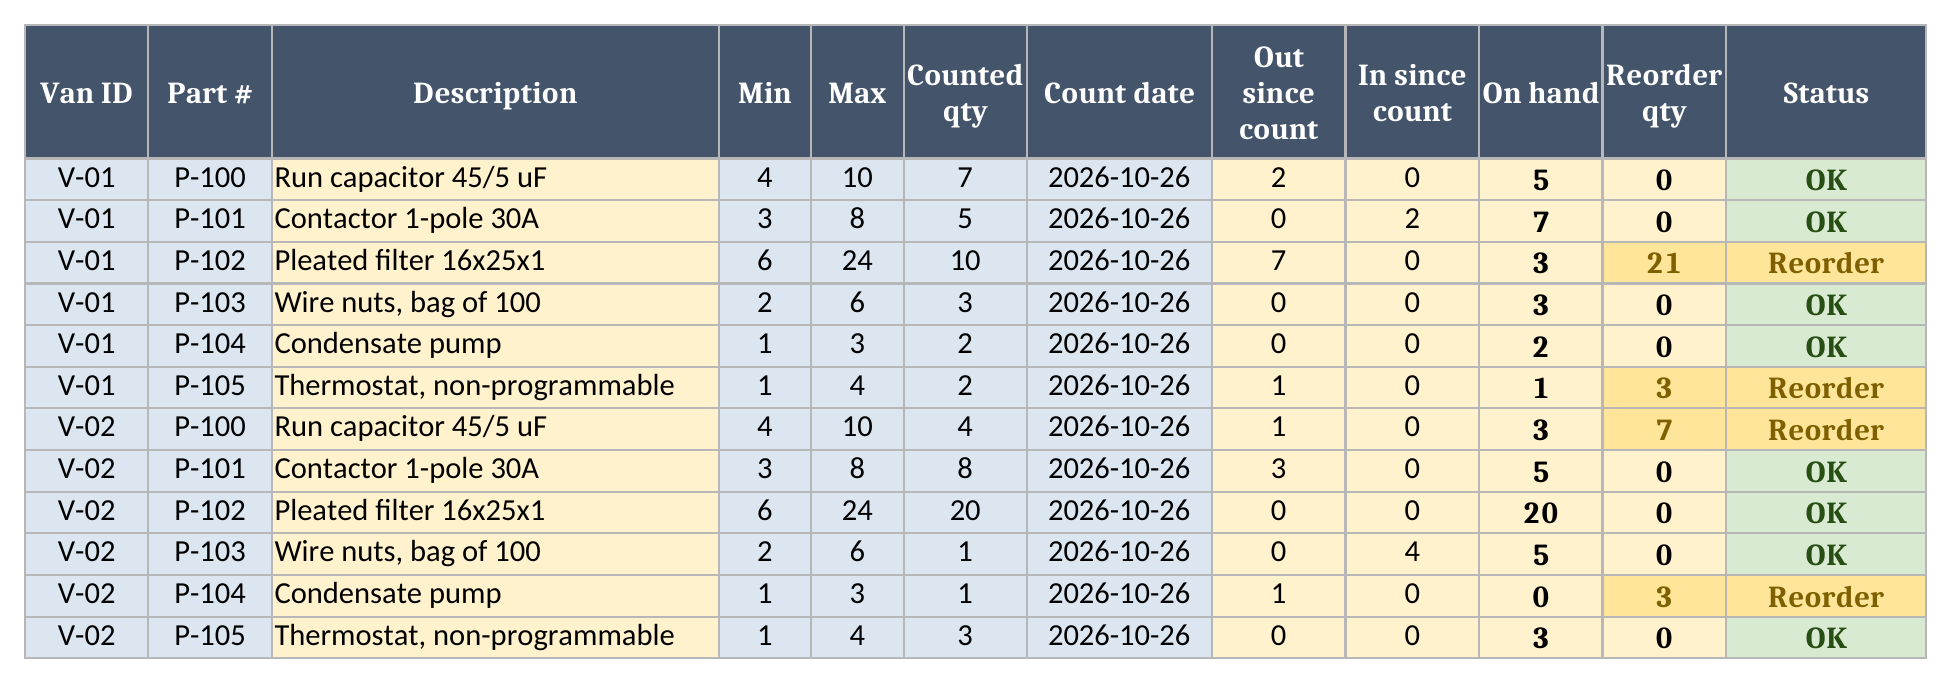
- Van Stock is the standard stock list, with one row per van and part. You type the min, the max, the counted quantity and the date of that count. The sheet works out Out since count, In since count, On hand, Reorder qty, Status, Unit cost, Stock value and Used since count, plus a Row check.
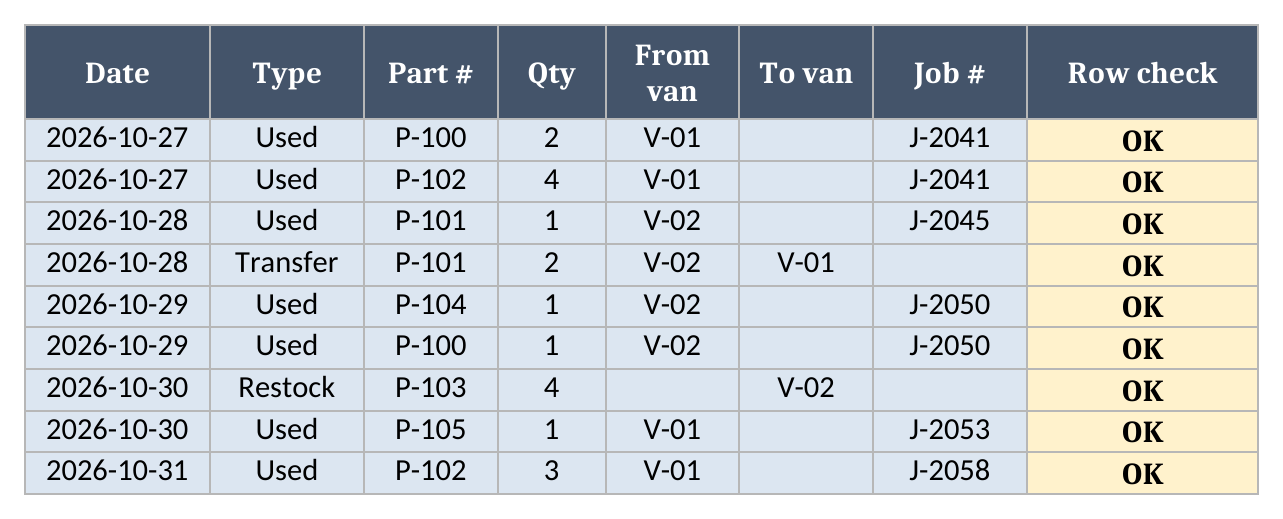
- Movements is the log. Every part used on a job, every restock and every transfer between vans gets one row with the date, type, part, quantity, the van it left or went to, and an optional Job #.
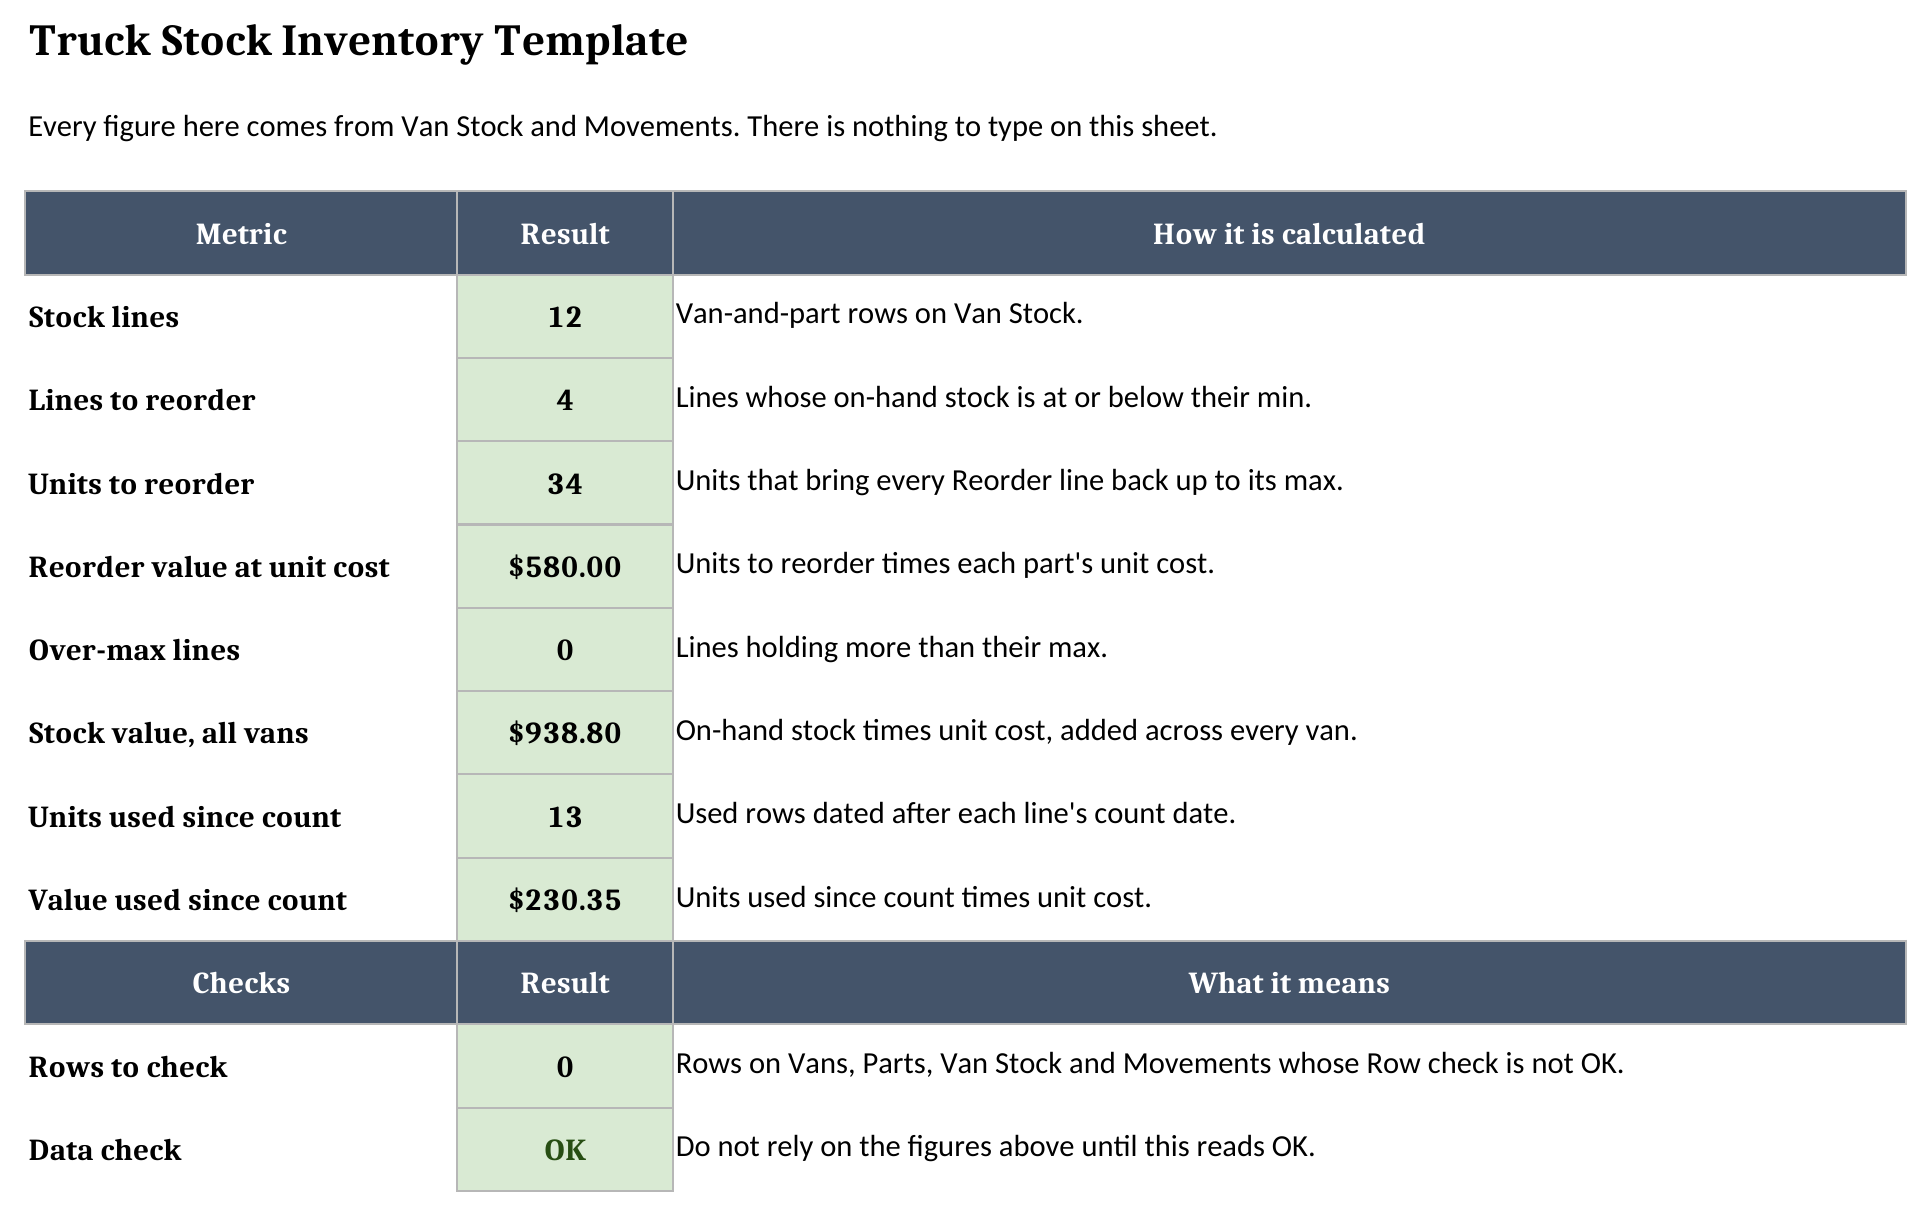
- Dashboard adds up lines and units to reorder, what the reorder would cost, over-max lines, the stock value across every van, and what has been used since each count.
Blue cells are for typing, yellow cells calculate, and green cells hold the headline results.
How to set it up
- If your spreadsheet app opens the file read-only, turn on editing so the formulas calculate.
- On Vans, replace the sample vans with yours. Keep each Van ID unique, because Van Stock and Movements use it as the key. Unit numbers, plates and fleet codes all work.
- On Parts, list what your vans carry, with a unique Part # and a unit cost. Type 0 for a part that costs nothing, because a blank cost counts as missing.
- On Van Stock, add one row for each part a van carries. Pick the Van ID and Part # from the dropdowns, then type the min and the max. The min is the level where you want to reorder, and the max is a full bin. Our entry on trunk stock optimization covers how to set those numbers from job history.
- Count each van and type the counted quantity and the count date on every line. A count doesn’t have to cover the whole van on one day, because each line keeps its own date.
- On Movements, clear the sample rows and start logging.
- Fix any Row check that isn’t OK, then confirm Data check on Dashboard reads OK.
How on-hand stock is worked out
You never type an on-hand figure. Each van-and-part line starts from its last physical count, and the sheet adjusts it with every movement logged after that count:
- Out since count adds up the Used and Transfer rows that took this part off this van.
- In since count adds up the Restock and Transfer rows that put this part on this van.
- On hand is the counted quantity, minus what went out, plus what came in.
The count date is the cutoff: only movements dated after it change the figure. Anything dated on or before the count date is treated as already reflected in the count, so a part used on the morning of the count doesn’t come off twice. When you recount a van, type the new quantity and date over the old ones and leave the earlier movements in the log. They fall behind the new cutoff on their own.
Take the pleated filters on V-01, Dana’s van. The count on 2026-10-26 found 10. Jobs on 2026-10-27 and 2026-10-31 used 4 and 3, so Out since count is 7 and On hand is 3.
Reorder up to max
Status reads Reorder when on-hand stock is at or below the line’s min, and Reorder qty is the number of units that brings it back up to the max. V-01’s filters have a min of 6 and a max of 24, so with 3 on hand the line reads Reorder for 21.
A line above its max reads Over max, which usually means a van is holding stock another van could use. A line below zero reads Check count: more went out than the count plus restocks allows, so either a movement is wrong or the count is.
Transfers between vans
A Transfer row names both vans and moves the stock in one step. In the sample, V-02 handed 2 contactors to V-01 on 2026-10-28. That one row takes 2 off V-02 and adds 2 to V-01, so V-01’s contactor line shows In since count 2 and On hand 7. V-02 also used one on a job that day, so its contactor line ends at 5.
Every movement has to land on a stock line. If a van named on the row has no Van Stock line for that part, Row check reads No stock line until you add one.
Worked example from the sample data
The sample has 12 stock lines across two vans, all counted on 2026-10-26, with nine movements logged over the following week. All of it is made up. 4 lines are at or below their min:
| Van | Part | Min | Max | On hand | Reorder qty |
|---|---|---|---|---|---|
| V-01 | P-102 Pleated filter 16x25x1 | 6 | 24 | 3 | 21 |
| V-01 | P-105 Thermostat, non-programmable | 1 | 4 | 1 | 3 |
| V-02 | P-100 Run capacitor 45/5 uF | 4 | 10 | 3 | 7 |
| V-02 | P-104 Condensate pump | 1 | 3 | 0 | 3 |
V-02 has no condensate pumps left. The only one on the van went out on job J-2050. Every other line reads OK.
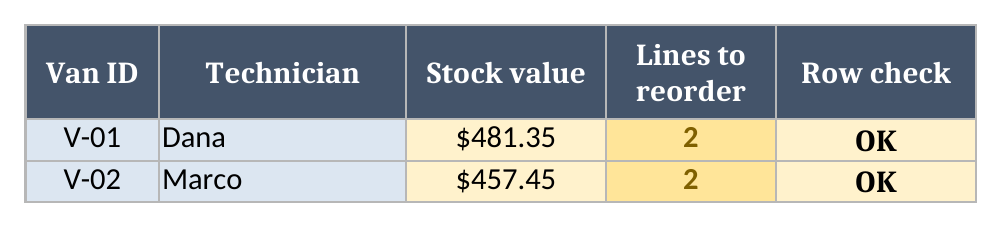
On Vans, V-01 carries $481.35 of stock and V-02 carries $457.45, at the unit costs on Parts. V-01 has 2 lines to reorder and V-02 has 2.
Here’s the Dashboard:
| Metric | Result |
|---|---|
| Stock lines | 12 |
| Lines to reorder | 4 |
| Units to reorder | 34 |
| Reorder value at unit cost | $580.00 |
| Over-max lines | 0 |
| Stock value, all vans | $938.80 |
| Units used since count | 13 |
| Value used since count | $230.35 |
Reorder value is units to reorder times each part’s unit cost, so it’s what topping up both vans would cost at the prices on Parts, before tax or delivery. Units used since count includes Used rows only, so a transfer between vans moves stock without counting as used. Read over a few counts, the used figures show how fast each van goes through a part, which helps when you set its min and max. These are sample figures.
Counting the vans
Counting catches what the log missed. A movement that never got logged, like a part grabbed for a callback or a filter left with a customer, stays in the on-hand figure until the next count replaces it. Before you type a new count, compare it with the On hand figure on that line to see how far the log had drifted. Our entry on the parts bin audit covers how to run a count and reconcile it against your records. The template doesn’t set a count schedule. Type each count with its date whenever it happens.
How it fits with a work order
The Job # column on Movements is optional, but filling it in ties each part used to a job. If you log jobs on our work order template, type the order’s WO # as the Job #. Each part that comes off a van then traces back to its order, and you can compare the parts cost on the order with what left the van. The rest of the set is on the free field service templates page.
Limitations to know before relying on it
- Every movement is typed in. Parts used on a job don’t come off the van unless someone logs them.
- A row with a blank, duplicate or unlisted Van ID or Part #, a missing or out-of-range value, a movement that names the wrong vans for its type, or a van with no stock line for the part shows a warning in Row check. Every Dashboard figure except Stock lines then reads Check data until Data check reads OK, and so do Stock value and Lines to reorder on Vans.
- Min, max, counts and quantities are whole numbers. The sheet tracks units, not lengths of wire or gallons of refrigerant.
- Unit cost is one figure per part. The sheet doesn’t track what each batch cost, and stock value is on-hand stock times that figure.
- It covers vans only. There’s no warehouse sheet, no purchase orders and no serial numbers.
- The workbook holds up to 50 vans, 200 parts, 500 van-and-part lines and 1,000 movements. Formulas and dropdowns stop at row 51 on Vans, row 201 on Parts, row 501 on Van Stock and row 1,001 on Movements.
- It’s one file. It doesn’t sync between technicians or send reorder alerts.
The first limitation is the one that tends to push a growing company off a spreadsheet. Once technicians record parts on the work order in a mobile app, field service software can take them off the right van automatically, with no separate log to keep.
Until then, grab the truck stock inventory template, set up your vans, and log the next part that comes off one.