

After three or four vendor demos, most buying teams can’t remember which product did what. Somebody liked the dispatch board, somebody else liked the price, and the loudest opinion in the room usually wins. Our field service software evaluation matrix puts the shortlist on one sheet: your criteria with the weights you choose, a 0 to 5 score for each vendor, a must-have gate that rules out any vendor with a gap you can’t accept, and a scorecard for the live demos.
Download the field service software evaluation matrix. It’s a plain .xlsx file with no macros and no sign-up. Replace the sample criteria, vendors and scores with your own, and the weighted scores, the gate and the ranking recalculate.
Video walkthrough
This short captioned walkthrough goes from the weighted criteria to the vendor scores, then shows the Dashboard ruling out a vendor that missed a must-have, and ends on this page’s address.
Who this template is for
We built it for service businesses choosing field service software for the first time or replacing a system they’ve outgrown: HVAC, plumbing, electrical, appliance repair and similar trades, from a few technicians to a few dozen. The person who keeps it is usually the owner, the operations manager or whoever is running the software search.
A vendor selection matrix answers four questions, and this one answers them for up to four vendors at a time:
- What do we need from the software, and how much does each item matter?
- Which requirements would make us turn a vendor down?
- How does each vendor score against our own list?
- Which vendor comes out ahead once the must-haves are applied?
If you haven’t built a shortlist yet, our vendor matcher narrows the field by trade, team size and budget. If you’re not sure the business is ready to switch at all, take the readiness quiz first.
What’s in the workbook
There are five sheets, in this order:
- Instructions covers setup, the 0 to 5 scale, the pass mark, how to use the demo scorecard, the color legend and the limitations, plus a note that every formula, layout choice and sample figure was written from scratch for this file.
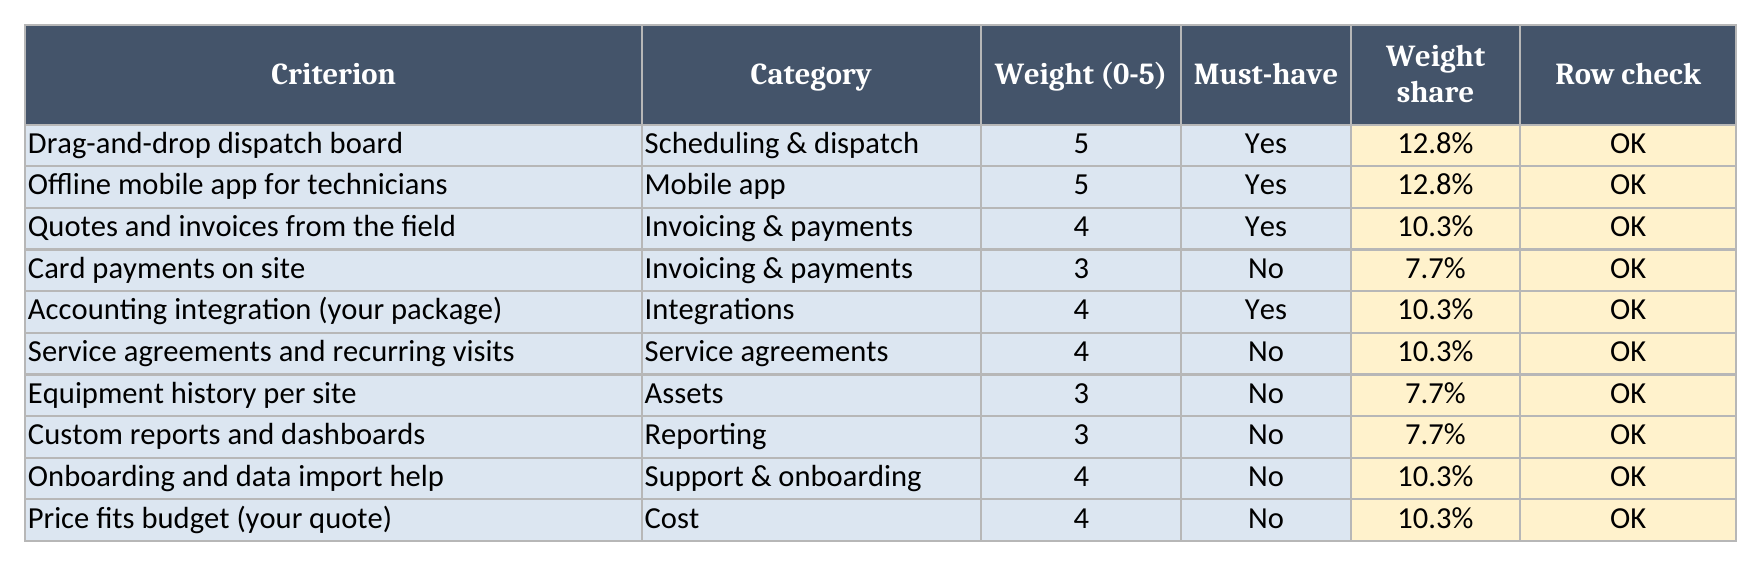
- Criteria is your requirements list: the criterion, a category, a weight from 0 to 5 and whether it’s a must-have. Weight share shows each weight as a part of the total, and a Row check flags any row with a missing or invalid entry. It holds up to 100 criteria.
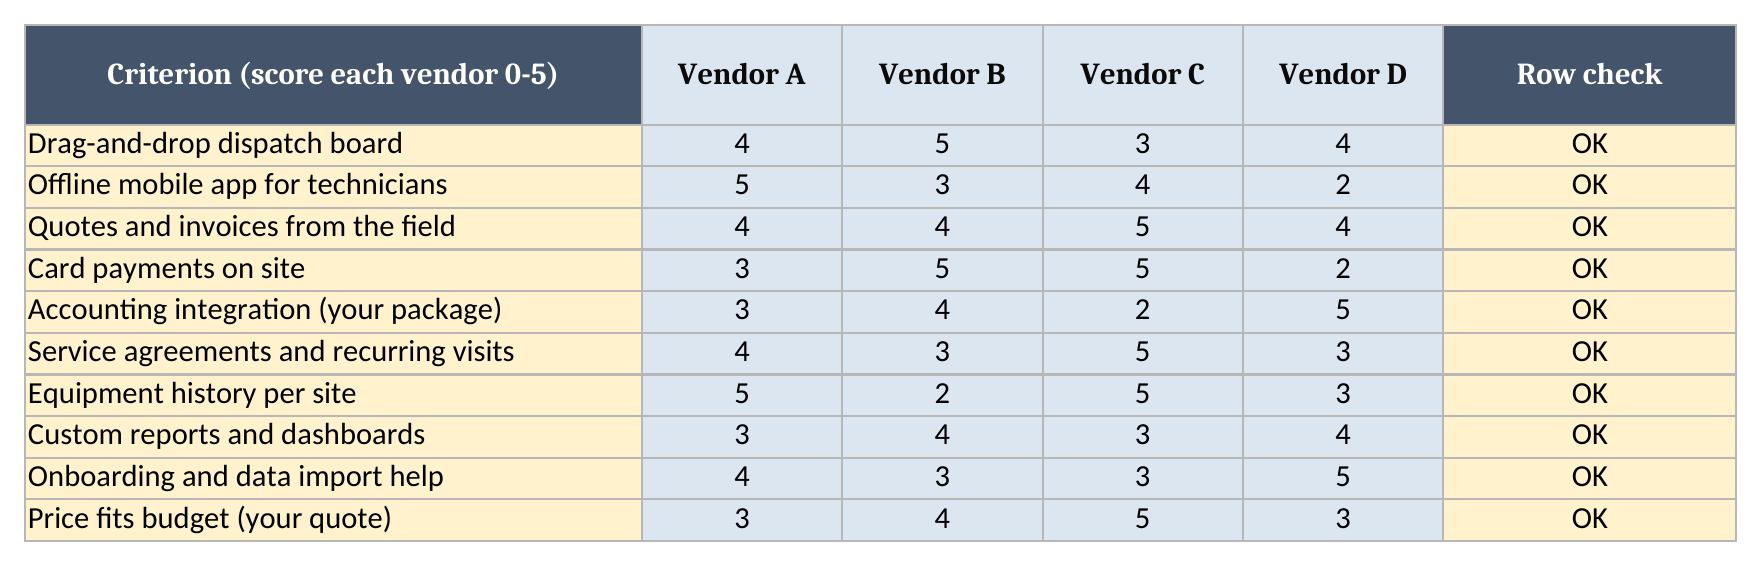
- Scores has your vendor names across the top and one row per criterion. You score each vendor from 0 to 5. Below the grid, each vendor gets weighted points, a weighted score, must-haves met, the gate result and a rank.
- Demo Scorecard lists the jobs you want each vendor to show you live, with a Pass, Partial or Fail for each vendor and an average demo score.
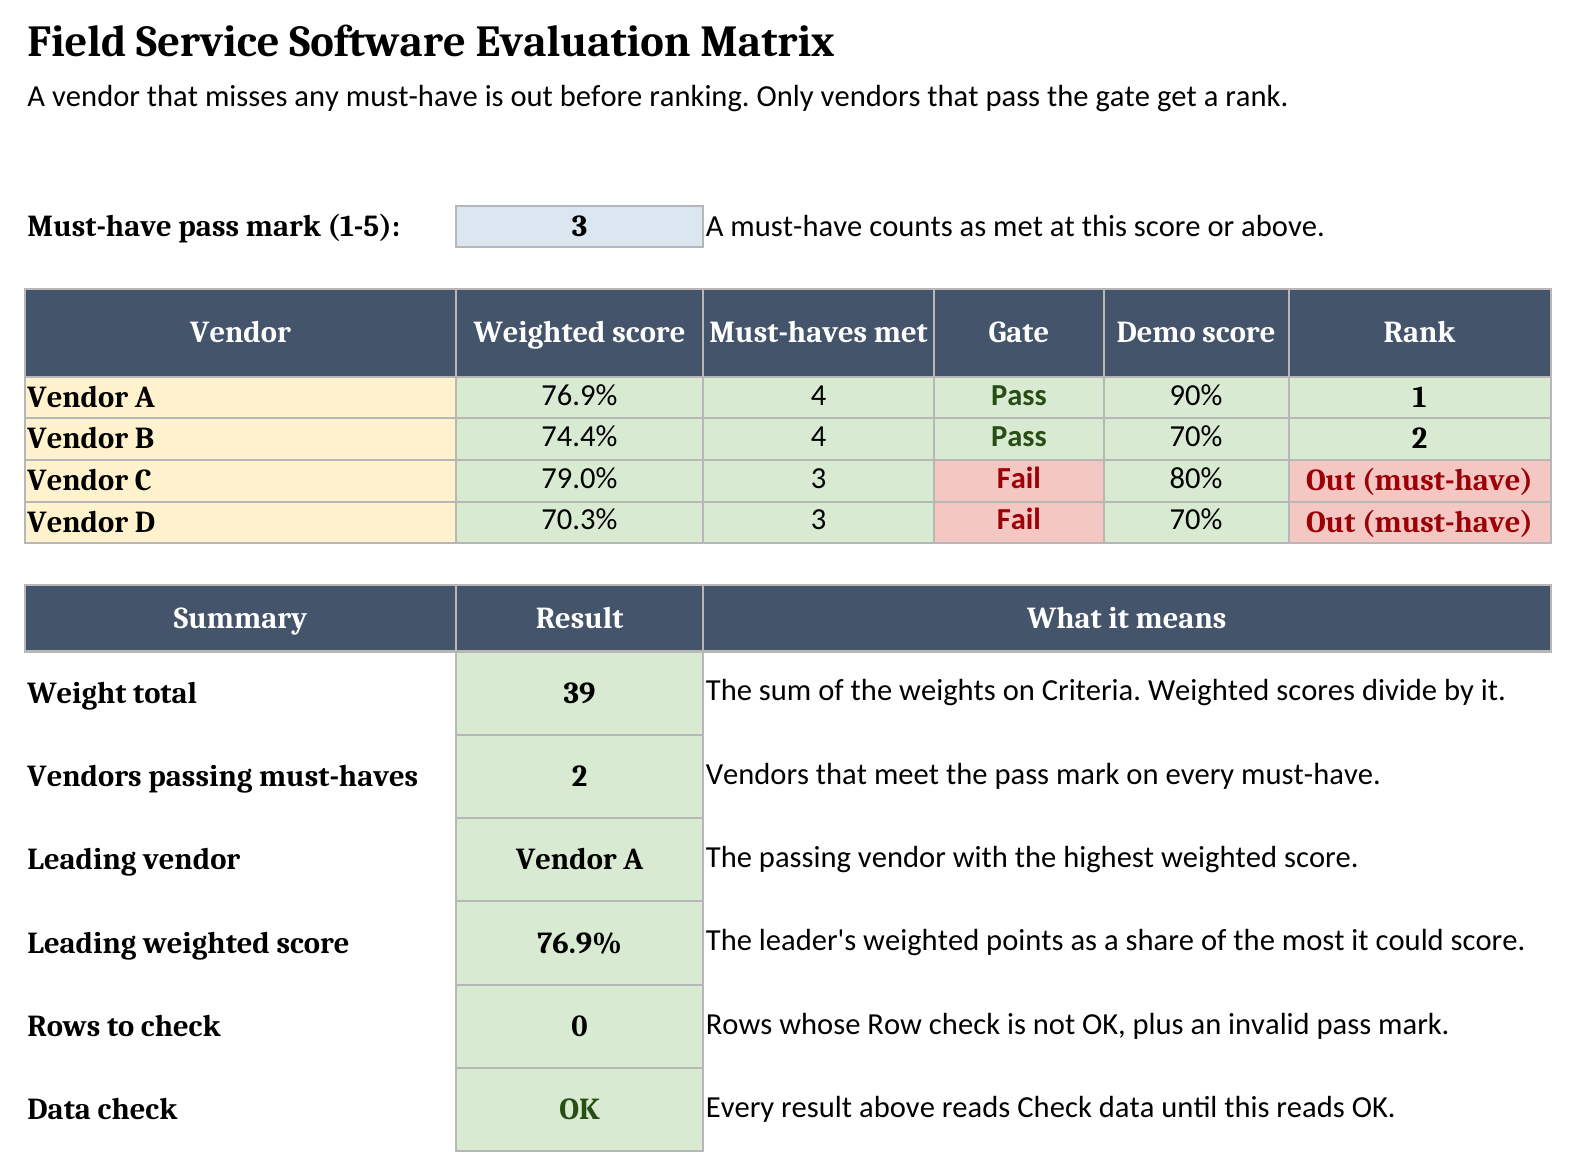
- Dashboard holds the must-have pass mark and one row per vendor with its weighted score, must-haves met, gate, demo score and rank, then the leading vendor and the data checks.
Blue cells are for typing, yellow cells calculate, and green cells hold the headline results.
How to set it up
- If your spreadsheet app opens the file read-only, turn on editing so the formulas calculate.
- On Criteria, replace the sample rows with your own requirements. Write each one so a vendor can be scored against it. “Offline mobile app for technicians” works. “Good mobile” doesn’t.
- Give every criterion a weight from 0 to 5. Mark it Yes under Must-have only if you’d turn a vendor down for missing it.
- On Dashboard, check the pass mark in B4. It’s 3 by default, so a must-have counts as met when the vendor scores 3 or more.
- On Scores, type your vendor names in B1 to E1. A column with no name is ignored, so the sheet works with anywhere from one to four vendors.
- Score each vendor from 0 to 5 on every criterion as you go through the demos and the RFP answers.
- Fix any Row check that isn’t OK, then confirm Data check on Dashboard reads OK.
Weighting the criteria
The weights decide the ranking more than any single score does, so set them before the first demo and agree them with the people who’ll use the software every day. We use a simple rule. A 5 is something the business can’t run without, a 3 saves real time every week, and a 1 is nice to have. Anything you’d score but don’t care about can sit at 0, and the sheet ignores it in the weighted score.
The sample adds up to a weight total of 39. Each vendor’s weighted points are the sum of weight times score across every criterion, and the weighted score divides that by the most the vendor could have earned: the weight total times 5. A vendor that scored 5 on everything would read 100%.
Set the weights first and then leave them alone. If a favourite vendor comes second and someone wants to push a weight up to fix that, the matrix stops being a fair comparison.
The must-have gate
A high average can hide a gap you can’t work around. A vendor might have a great dispatch board, a polished mobile app and a good price, and still lack a working connection to your accounting package. Averaged with everything else, that one low score barely moves the total. In day-to-day work it means typing every invoice twice.
So the matrix checks the must-haves before it ranks anyone. Each criterion marked Yes needs a score at or above the pass mark. A vendor that falls short on even one is out, and its rank reads Out (must-have) whatever its weighted score. Only the vendors that pass get a rank, and the leading vendor is always one of them.
Lowering the pass mark doesn’t fix a missing capability. If a must-have keeps ruling out every vendor, ask whether it’s really a must-have, or whether the market doesn’t offer it at your price yet.
Worked example from the sample data
The sample compares four made-up vendors, Vendor A to Vendor D, on ten criteria. Four of the criteria are must-haves: the dispatch board, the offline mobile app, quotes and invoices from the field, and the accounting integration. Here’s the Dashboard:
| Vendor | Weighted score | Must-haves met | Gate | Demo score | Rank |
|---|---|---|---|---|---|
| Vendor A | 76.9% | 4 of 4 | Pass | 90.0% | 1 |
| Vendor B | 74.4% | 4 of 4 | Pass | 70.0% | 2 |
| Vendor C | 79.0% | 3 of 4 | Fail | 80.0% | Out (must-have) |
| Vendor D | 70.3% | 3 of 4 | Fail | 70.0% | Out (must-have) |
Vendor C has the highest weighted score in the sample at 79.0%, but it scored 2 on the accounting integration, below the pass mark of 3. It’s out before the ranking. Vendor D misses the offline mobile app the same way. That leaves 2 vendors passing every must-have, and Vendor A leads them at 76.9%.
Change the accounting integration from a must-have to an ordinary criterion and Vendor C passes the gate and moves into first place. So the choice between A and C comes down to whether you could live with C’s accounting connection, and the gate puts that question in front of you before anyone signs.
Scoring the demos
A weighted score built from RFP answers rewards the vendor that writes the best answers. The Demo Scorecard checks what the software does with your own work. List the jobs you want to see before the demos start, and ask every vendor to run the same ones live:
- book, dispatch and reschedule a job
- complete a job with the phone offline and sync it later
- take a job from quote to invoice to payment
- set up a maintenance agreement with recurring visits
- pull last month’s revenue by technician
Mark each vendor Pass, Partial or Fail on each one, with a note on what you saw. The sheet scores Pass as 1, Partial as 0.5 and Fail as 0, and averages them into a demo score. In the sample, Vendor A’s demo score is 90.0% and Vendor B’s is 70.0%.
The demo score is shown next to the weighted score and doesn’t change it. If a vendor’s demo score is far below what its weighted score suggests, that gap is worth a follow-up call before you sign anything.

How it fits with an RFP
The matrix works best with a written RFP behind it. Our RFP builder puts your operating context and the hard vendor questions about pricing, data export, offline use and contract terms into one document you can send to every vendor. When the answers come back, turn the requirements that matter into criteria on this sheet and score each vendor on what they wrote and what they showed you in the demo. More free tools for running the business are on our free field service templates page.
Using it in a browser-based spreadsheet app
The file is a standard .xlsx. If you work in a browser-based spreadsheet app, import the file rather than opening it from a preview: in most apps that’s File > Import, then upload the file. After importing, check that the Dashboard shows the same sample results before you replace the data.
Limitations to know before relying on it
- It compares up to four vendors. A longer list needs narrowing first.
- Scores and weights are whole numbers from 0 to 5. There’s no half-point scoring.
- The scores are only as good as the evidence behind them. The sheet doesn’t check what a vendor claims.
- Cost is one criterion among the others. The matrix doesn’t build a total cost of ownership or compare quotes line by line.
- The demo score is shown next to the weighted score, not added into it.
- A row with a missing or invalid entry, an out-of-range score, or an unscored criterion for a named vendor shows a warning in Row check. Every result on the Dashboard then reads Check data until Data check reads OK.
- It’s one file. Several people scoring separately need their own copies, and someone has to combine them.
For larger teams, have each person score on their own copy before the group meets, then compare. The meeting can then start from everyone’s scores, and the first person to speak doesn’t set the result.
When the shortlist is ready, grab the field service software evaluation matrix, set your weights, and score the first demo while it’s still fresh.